Wiki
Clone wikiaktivecortex / tracing
Tracing
A module named tracing is included in the framework to gather timing data and gain deeper knowledge about distributed system runtime behavior.
During development Tracing helps the developer to verify that the implementation of multi step processes is consistent with their design.
In a production environment tracing helps the system administrator to verify the application's correct behavior allowing a precise identification of bottlenecks and possible delays.
To permit tracing in production the implementation must be light enough to not introduce a significant slowdown in the application, but also, it must be able to apply tunable request sampling in order to limit to the minimum the introduced overhead.
To be functional a tracing system should also:
- Support the collection of large amounts of data,
- Permit the export of the data in an open format,
- Perform the aggregation and reporting deferred on different machines than those on which the application is running,
- Be modular and flexible enough to be easily integrated within the enterprise platform.
Architecture
Since a picture is worth a thousand words, depicted below is the tracing architecture:
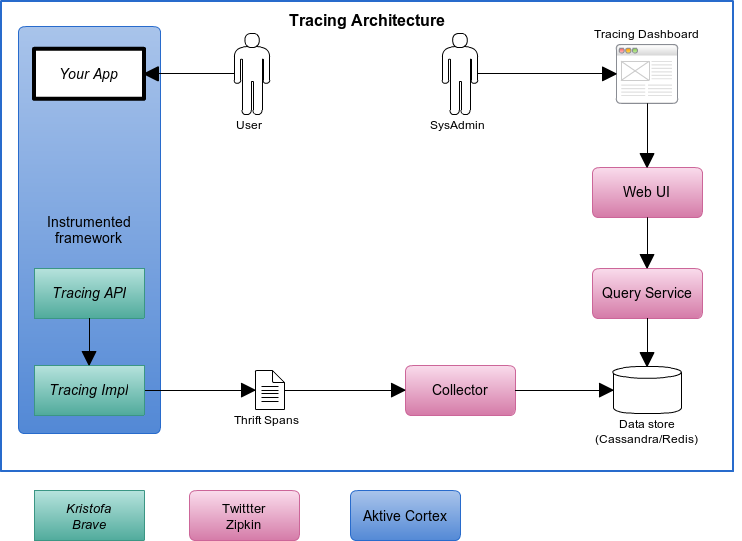
Aktive Cortex instrumentation, implemented in the tracing module, is realized thanks to the excellent Brave library. Trace data collection, query and reporting is performed by the awesome Twitter Zipkin.
My sincere thanks goes to the authors of both projects for their excellent work and for making it available under open source license.
For a detailed explanation of the tracing design please refer to the Brave project documentation and to Zipkin documentation site.
Quick Start
To enable tracing in a Aktive Cortex based project simply add the tracing module dependency to the application pom:
    <dependency>
          <groupId>org.aktivecortex</groupId>
          <artifactId>aktivecortex-tracing</artifactId>
          <version>${aktivecortex.version}</version>
    </dependency>
Then it's just a matter of importing the tracing context in the main Spring Application Context.
For this purpose, two example contexts are provided:
It's a context that is meant for development purposes that collect tracing data on a SLF4J logger without applying any filtering aimed at restricting the rate of data collection.
This context is meant for production environments where tracing data is collected and submitted to a dedicated Zipkin collector. Tracing rate is limited by a configurable filter to limit to the introduced tracing overhead.
This last context is configurable via the following environment variables:
tracing.host.IP
The IP of the machine where Zipkin Collector Service is running.
tracing.host.port
The port of the Zipkin Collector service.
tracing.samplingfilter.rate
The selected sampling rate (a double value in the 0-1 range).
Zipkin Virtual Appliance
A virtual appliance was prepared to simplify and speed up the implementation of the Zipkin based tracing during the development phases.
The appliance, exported in the Open Virtualization Format to be compatible with most diffused hypervisors, is available here
Be CAREFUL! the appliance size it's big (2.8 GB)
The appliance based on the latest Ubuntu Server, 13.04, at boot starts Cassandra and all the fundamental Zipkin services (Collector, Query and Web UI), however, does not include Zookeeper and is not meant for use in a production environment.
Appliance Settings
The VM is set to start with 2 gb of ram and 2 cores assigned (the minimum to make it work acceptably).
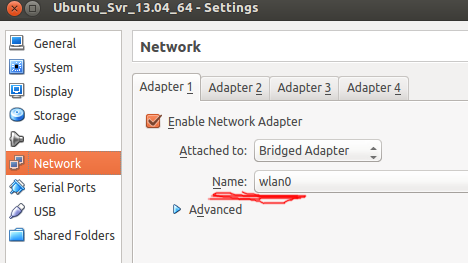
The networking mode is bridged. If the host is connected via a network cable change the settings for the interface host to be used:
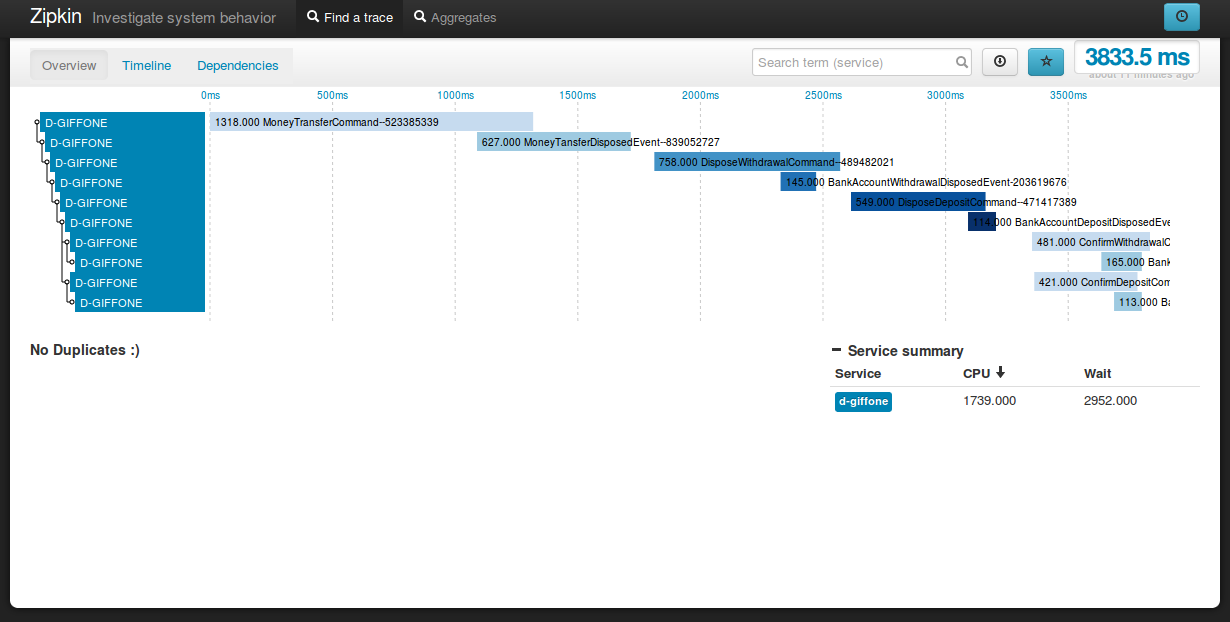
After the bootstrap, wait a moment to give the room to start each of the aforementioned services, after that you can connect to the Zipkin Web with the machine assigned IP address.
The VM user credentials are:
root/reply
At prompt enter:
$ ifconfig
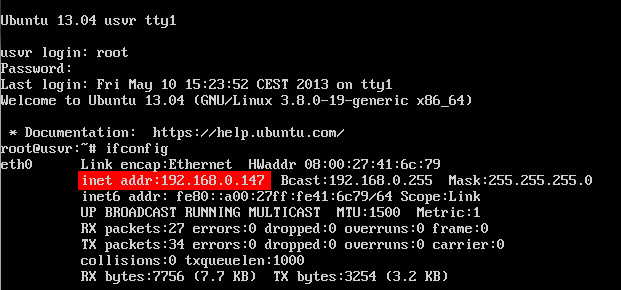
Then type the IP address in the browser with port 8080 (in my case: http://192.168.0.147:8080/) to access the dashboard:
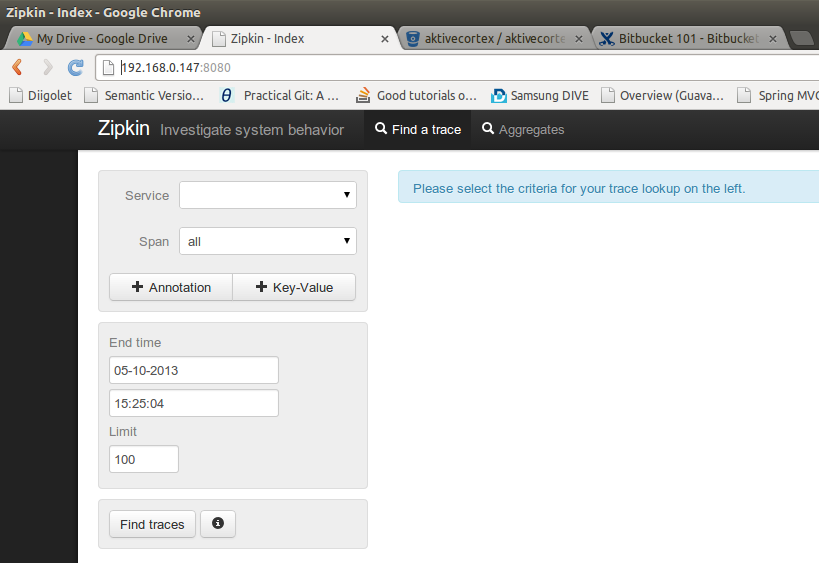
Happy tracing!
Updated