Wiki
Clone wikiBaristaSource / UserGuide / MenuMonoplotting
Menu Monoplotting
The menu Monoplotting contains the functions to start monoplotting in one of four different monoplotting modes. Selecting any of these menu items has exactly the same effect as selecting the respective icons in the Barista toolbar.
- Monoplot Points
- Monoplot Lines/ Monoplot Snake Lines
- Monoplot Buildings
- Measure Heights
Monoplotting is finished by clicking on the selected monoplotting mode icon on the Barista toolbar again.
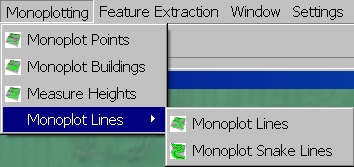
Barista Monoplotting Menu
The following data have to be available in the project for monoplotting:
- At least one Image node with either an RPC node or an Affine node that serves as a sensor model
- At least one DEM node.
Selecting a DEM
Any monoplotting mode will always use the active DEM for monoplotting. If no DEM has been declared to be the active one by the user (cf. DEM node) and if there is only one DEM in the project, that DEM will automatically be selected as the active one by the software. If no DEM has been declared to be the active one and if there are multiple DEM nodes in the project, Barista will open a dialog in which the user has to select active DEM. The boundary of the area in which the DEM contains valid grid heights will be determined and backprojected to all open image views in yellow, and the user can start monoplotting. All monoplotting results will be determined and stored in the co-ordinate system of the DEM node.

The DEM boundaries back-projected to a satellite image.
If there are multiple DEMs in the project, the user can at any time select another DEM to be the active one (cf. DEM node). This has the effect that the boundaries of the new DEM will be backprojected to all open image views.
Caution: if the user selects a new active DEM during monoplotting, from then onwards, the monoplotting results will be determined and stored in the coordinate system of the new DEM node. If these DEMs are given in different coordinate systems, so will the monoplotting results. This means that in order to obtain consistent results in monoplotting, all DEMs in one Barista project should refer to the same coordinate system.
Selecting the image and the sensor model
The monoplotting function corresponding to the selected monoplotting mode will be invoked whenever the user digitizes a point in any open image view. Barista will check whether that image view has a current sensor model (either an RPC node or an Affine node) and then use that sensor model. If no current sensor model is available for the image node corresponding to the image view, an error message will be issued, and no action will be taken. If at any stage the user selects a new current sensor model, from that time onwards the new current sensor model will be used for monoplotting.
Opening a new image view by a double click into the corresponding image node will result in the DEM boundaries and all monoplotted entities being backprojected and displayed in the new image view, and monoplotting can be done immediately in the new image view.
Monoplot Points

Monoplotting Points
Monoplotting Points will determine 3D points from the selected image coordinate using a DEM. The resulting 3D points are stored in a new or existing 3D point node that by default will be called 'MonoplottedPoints'. The icon of the 3D point node is selected according to the definition of the coordinate system of the DEM (TM, UTM, Geocentric, Geographic). There will only be one such 3D point node in the Barista project. The measured image coordinates of the monoplotted point will be stored in a 2D point node that will be a sub-node of the image node corresponding to the image view in which the point was measured.
In the point monoplotting mode, a monoplotted point will be backprojected to and displayed in all open image views. In the image view in which the point has been measured, it will be displayed in green colour. In all other image views, it will be displayed in magenta.
When a point has been determined in 3D, its 3D coordinates are displayed in a Monoplotting Dialog. By changing the coordinate type, its coordinates according to the selected type can be displayed. However, only the coordinates corresponding to the definition of the DEM coordinate system will be stored.
By default, the point label will be MPOINTn, where n is a number that is incremented after each point. That convention can be overridden by pressing the Key L in the same way as in the point digitisation mode.
Monoplot Lines
There are two possible options for the monoplotting of lines - to monoplot normal lines (Monoplot Lines), or with the Snake algorithm optimized lines called snake lines (Monoplot Snake Lines).
Monoplot Lines

Monoplotting Lines
Monoplotting Lines will create 3D polylines and will add 3D points to the current polyline until the line is finished (by pressing Key F) or closed (by pressing Key C). The resulting 3D polylines are stored in a new or existing XYZ polyline node that by default will be called 'XYZLines'. There will only be one such XYZ polyline node in the Barista project. The measured image coordinates of the monoplotted line points will be stored in a 2D point node that will be a sub-node of the image node corresponding to the image view in which the point was measured.
In the line monoplotting mode, a monoplotted XYZ Polyline will be backprojected to and displayed in all open image views in cyan. If the 2D point node containing the image coordinates of the line points is active, these image points will be displayed in the image view in which the line was digitized.
By default, the line label will be MLINEn, where n is a number that is incremented after each point. That convention can be overridden by pressing the Key L in the same way as for points in the point digitisation mode. The labels of the line points cannot be changed. If a line is called LINE, its points will have the labels LINE_P0 to LINE_Pm, where m is the number of points in the line.
Pressing the Esc Key during monoplotting a 3D polyline will discard the measurements of the current 3D polyline and also removes its image coordinates.
Monoplot Snake Lines
The Monoplot Snake Lines function is used similar to the Monoplot Line function with the difference being that after pressing Key F or Key C to finish the line, a Snake dialog box will pop up.
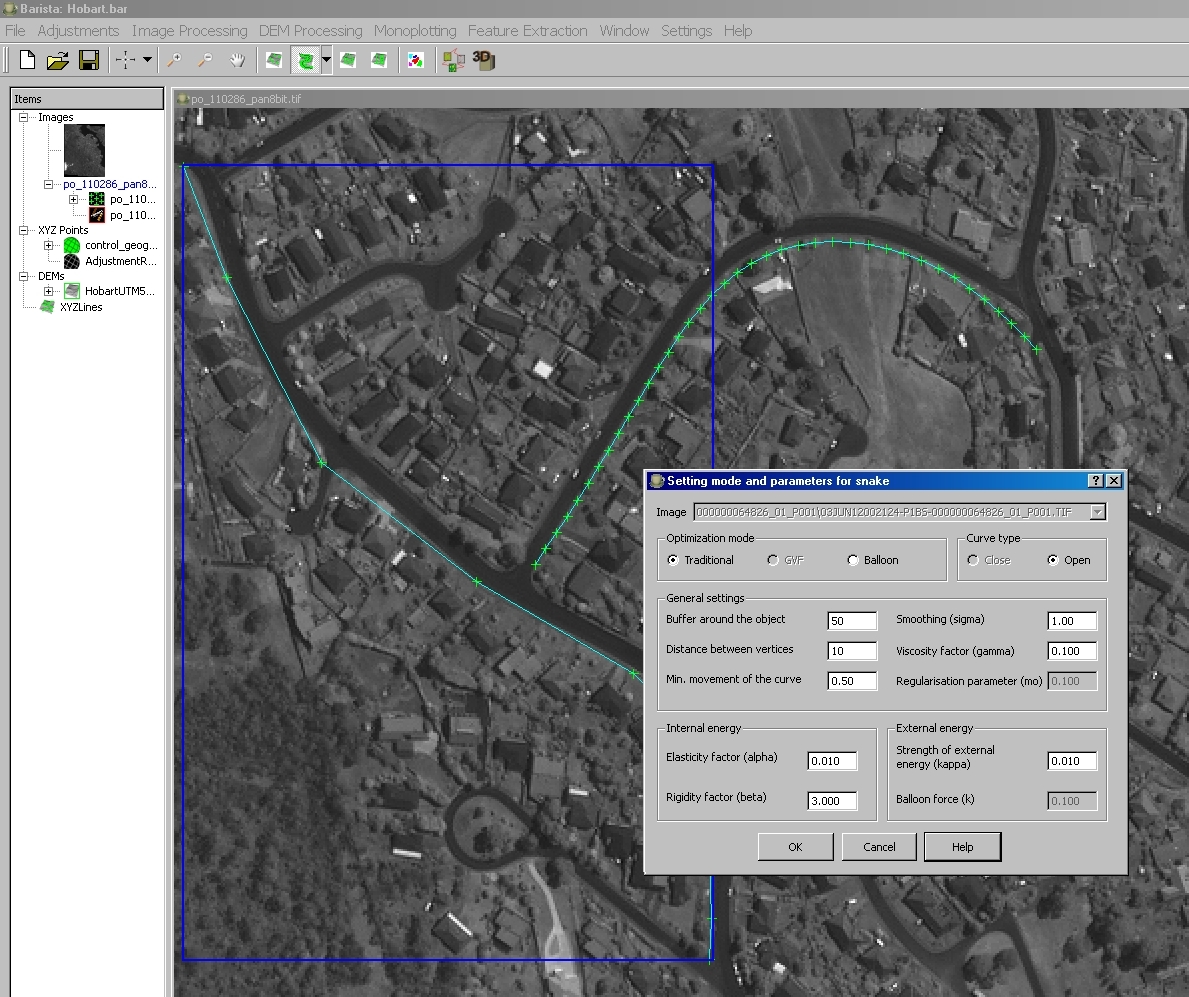
Monoplotting Lines
It is possible to select between 3 different optimization modes - Traditional Snakes, GVF (Gradient Vector Field) Snakes (implementation not finished yet) and Balloon Snakes. The curve type is selected by pressing Key F or Key C during the digitizing of the start points beforehand. Following table gives an overview of all parameters with detailed information.
| Parameter | Standard Value | Min. Value | Max. Value | Description
---|---|---|---|---|---
General Settings | Buffer around the object | 100 pixel | 0 pixel | non | Buffer size is limited
through the picture themselves.
| Distance between vertices | 10 pixel | 2 pixel | 50 pixel | Approximated distance between two
snake points.
| Min. movment of the curve | 0.5 pixel | 0.1 pixel | 30 pixel | Stop the iteration process of the
snake calculation if the average distances between points of two following iterations move less then
this threshold.
| Smoothing (sigma) | 1.0 | 0.1 | 50.0 | Smoothing factor to smooth the images using Gaussian
| Viscosity factor (gamma) | 0.1 | 0.0 | 100.0 | Step size
| Regularisation Parameter (mo) | 0.100 | 0.0 | 100.0 | Just used for GVF snakes.
Internal Energy | Elasticity factor (alpha) | 0.010 | 0.0 | 100.0 | Weight of first derivation.
| Rigidity factor (beta) | 3 | 0.001 | 100.0 | Weight of second derivation.
External Energy | Strength of external energy (kappa) | 0.01 | 0.0 | 100.0 | .
| Balloon force (k) | 0.1 | 0.0 | 100.0 | Just used for Balloon Snakes
Parameters for the Monoplot Snake Lines function
Monoplot Buildings
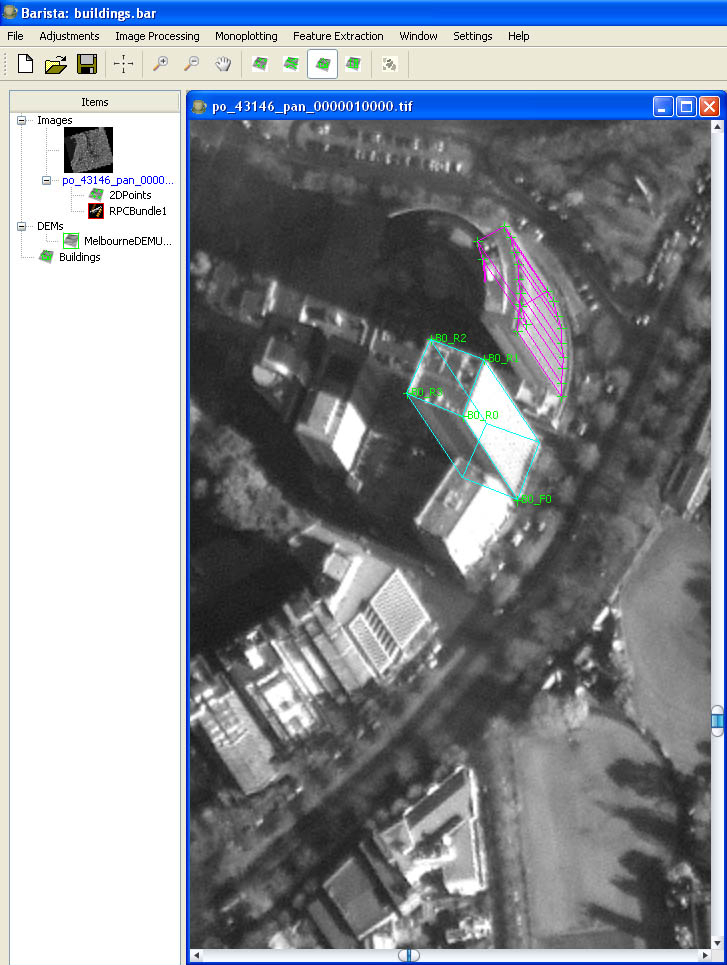
Monoplotting Buildings
The building monoplot mode can be used to determine prismatic building models (i.e., building models having horizontal roof planes) that are modelled in boundary representation (cf. Building node for details on the modelling of buildings). In Barista, any modelled building will be added to a Building node that is by default called 'Buildings'. If that building node does not exist yet, it will be created upon finishing the first building. The image points measured during building monoplotting will be stored in a 2D point node that will be a sub-node of the image node corresponding to the image view in which the point was measured.
The basic procedure for monoplotting a building works as follows:
-
Measure one floor point of the building in one image (i.e. the intersection point of one building edge with the terrain); thus, for the method to work it is essential that one floor point of a building is visible in the image. That point's 3D coordinates are determined by monoplotting
-
Measure the roof point corresponding to that floor point in the same image. That roof point's 3D coordinates will be determined by intersecting the image ray with a vertical pole passing through the floor point.
-
Measure the remaining roof boundary points in the image. Their 3D coordinates will be determined by an intersection of the image ray with a horizontal plane passing through the first roof point. The height of the corresponding floor point is determined from the DEM.
-
After having measured the last roof point, press the Key F to close the roof polygon and finish the building.
At any stage of monoplotting, all monoplotted buildings are backprojected to and displayed in all open image views in cyan color. The current building is displayed in yellow; the current building part is displayed in magenta. By pressing the Key F, the finished building part will become the current building and thus be displayed in yellow. If the user goes on to digitize another building, the colour of that building will change again, this time to cyan.
During the measurement process, pressing the Backspace Key will delete the previously measured point. Pressing the Esc Key will discard the current building part (displayed in magenta), including the measured image points. Pressing the Delete Key will delete the current building (i.e., the building displayed in yellow).
An existing building (displayed in cyan) can be selected to be the current one (displayed in yellow) by pressing the Shift Key and at the same time clicking into the building in one of the open image views using the left mouse button. As an alternative, buildings can be selected in the Building table. In the building table, multiple buildings can be selected, and they will be displayed in yellow; in this case, the Delete Key will not delete all yellow buildings, but multiple buildings can be deleted in the building table. If multiple buildings are selected (displayed in yellow), pressing the Esc Key will unselect them (i.e., change their colour from yellow to cyan).
The current building (displayed in yellow) can be modified in one of two ways:
-
Monoplotting inner courtyards
-
Monoplotting superstructures.
Monoplotting inner courtyards: Pressing the C Key will start the inner courtyard mode. This will be indicated by a red 'C' attached to the mouse cursor. An inner courtyard can only be monoplotted if there is a current building, displayed in yellow. An inner courtyard is monoplotted as follows:
-
Measure one roof point of the inner courtyard. That roof point has to be inside one of the roof faces of the current building. Barista will intersect the corresponding image point with all roof planes. It will check whether the intersection is within the boundary polygons of the roof planes. Of all roof faces containing the intersection point with the image ray, the actual face from which the courtyard will be cut out is selected to be the face having the intersection that is closest to the sensor.
-
Measure the remaining roof boundary points of the courtyard in the image. Their 3D coordinates will be determined by an intersection of the image ray with the selected roof plane. The height of the corresponding floor point is determined from the DEM. Any roof point thus measured has to be inside that roof plane; any measured point outside the roof plane will be ignored.
-
After having measured the last roof point, press the Key F to close the polygon and finish the inner courtyard. At this instance, the inner courtyard will be cut out from the selected roof plane. Pressing the Key F will also terminate the inner courtyard mode.

Monoplotting an inner courtyard
Pressing the Esc Key will terminate the inner courtyard mode and discard all measured points.
Monoplotting superstructures: Pressing the S Key will start the superstructure mode. This will be indicated by a red 'S' attached to the mouse cursor. A superstructure can only be monoplotted if there is a current building, displayed in yellow. A superstructure is monoplotted as follows:
1. Measure one base point of the superstructure (i.e., the intersection of a vertical edge of the superstructure with an existing roof plane). That base point has to be inside one of the roof faces of the current building. Barista will intersect the corresponding image point with all roof planes. It will check whether the intersection is within the boundary polygons of the roof planes. Of all roof faces containing the intersection point with the image ray, the actual face onto which the superstructure will be put is selected to be the face having the intersection that is closest to the sensor.

2. Measure the roof point of the superstructure corresponding to that base point in the same image. That roof point's 3D coordinates will be determined by intersecting the image ray with a vertical pole passing through the base point.

3. Measure the remaining roof boundary points of the superstructure in the image. Their 3D coordinates will be determined by an intersection of the image ray with a horizontal plane passing through the first roof point. If the planimetric position of a roof point is within the roof face onto whicht the superstructure is built, the height of the corresponding base point will be determined as the height of that roof plane; otherwise, the height of that base point will be determined from the DEM. Thus, it is possible to monoplot superstructures that pass beyond the boundaries of the existing building.

4. After having measured the last roof point, press the **Key F** to close the polygon and finish the superstructure. If all base points are inside the selected roof plane, the superstructure will be put on top of the selected roof plane (thus cutting out the base polygon of the superstructure as an inner loop). If this is not the case, the superstructure will be added to the current building by a Boolean union operation, intersecting the boundary representation of the current building with a vertical prism defined by the roof polygon of the superstructure. Pressing the **Key F** will also terminate the superstructure mode.
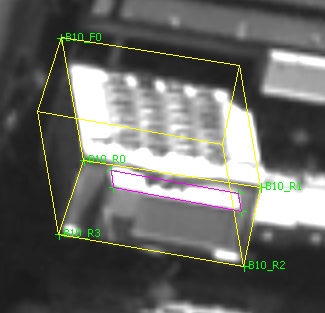
Monoplotting a superstructure
Pressing the Esc Key will terminate the inner courtyard mode and discard all measured points.
The building labels by default will be Bn, where n is a number that is incremented after each building. That default can be overridden by pressing the Key L in the same way as for points in the point digitisation mode. Note that the building labels are important for determining the layers in the DXF export of buildings. The labels of the building points cannot be changed. If a building is called BUILDING and the number of points of the roof polygon of a building part is m, the point labels will be as follows (i starts from 0):
  * Roof points of the first building part will have the labels BUILDING_R0 to BUILDING_Rm
  * Floor points of the first building part will have the labels BUILDING_F0 to BUILDING_Fm
  * Roof points of superstructure i will have the labels BUILDING_SiR0 to BUILDING_Si_Rm
  * Floor points of superstructure i will have the labels BUILDING_SiF0 to BUILDING_SiFm
  * Roof points of inner courtyard i will have the labels BUILDING_CiR0 to BUILDING_CiRm
  * Floor points of inner courtyard i will have the labels BUILDING_CiF0 to BUILDING_CiFm
Project backup: A backup of the Barista project file is automatically saved after every 10th building. If the Barista project file is called 'PROJECT.BAR', the backup will be alternatively saved to the files 'PROJECT_BACKUP1.BAR' and 'PROJECT_BACKUP2.BAR'. Thus, the two most recent backup files will be available. Should the program crash, work can be continued from any of these project files.
Measure Heights
Measure heights
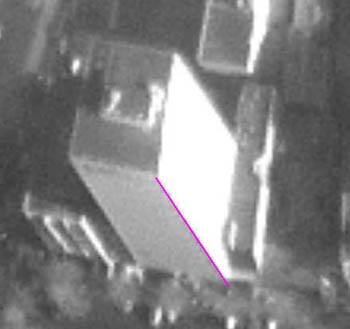
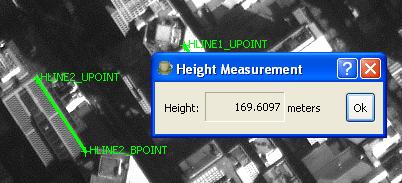
Measure Heights is used to measure height differences between points with the same XY-position. Starting with measuring the ground point followed by the point above, a height difference is calculated and displayed in a popup dialog box. The top and bottom points of the height are also shown on the screen.
Presenting the results of height measurement
While measuring heights, each pair of top and bottom object points are recored as a 3D line in a node called ‘HeightLines’ node which should be located on the left of the screen within the project tree. At any time, the user can export the lines into different formats, including shapefiles, by clicking right mouse button on the ‘HeightLines’ node.

Saving the height measurements
Updated