Wiki
Clone wikienterobase-web / outbreakexample
Top level links:
- Main top level page for all documentation
- EnteroBase Features
- Registering on EnteroBase and logging in
- Tutorials
- Using the API
- About the underlying pipelines and other internals
- How schemes in EnteroBase work
- FAQ
Outbreak! Applying EnteroBase to real data
Search an outbreak strain
In the Salmonella database, search for name equals CFSAN037834. Let’s pretend we have just uploaded this strain and want to find out if it part of an outbreak

Finding Nearest Neighbours
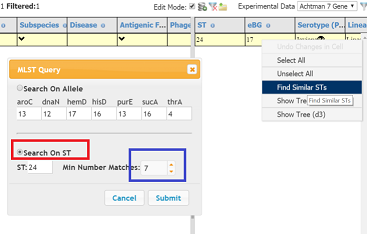
- In Experimental Data dropdown choose Achtman 7 Gene. Right click on the row in the experimental pane and select Find Similar STs in the context menu
- In the dialog be sure that search on ST is checked (red box). In this case we are finding complete matches i.e. 7 out of 7 alleles (blue box) must match, however we can be less stringent and reduce this number , which we will want to do in larger schemes where there are more alleles (e.g. cgMLST and rMLST).Press subit
- Over 400 strains will be loaded into the browser. Now save this Workspace > save. Call it MLST_Achtman_ST24 or something else equally descriptive.
Create a Minimum Spanning Tree
- Once the workspace has been saved an Analysis tab should appear on the top menu. Before we create the MS tree we need to change the experimental data to cgMLST (3020)
- Next Analysis > Create MS tree. Make sure the scheme cgMLST is specified else your tree will be built on 7 gene MLST data and contain just one node. Call the tree ST_24 and press submit, a new window should open with a Waiting dialog. If this is not the case then check that your browser allows pop ups from this site. The tree can be reloaded by Analysis> Load MS Tree > Tree_name
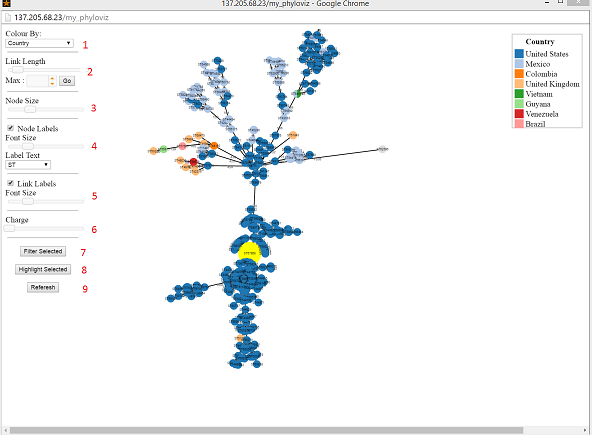
- Once the tree has loaded, the first thing we are going to do is find our original strain. In the main window we want to filter our data wither the filter icon (funnel) or view > Filter Data and select name and type (or paste) CFSAN037834 in the text box
- A single row should be visible. Select this row and then return to the Tree window and press highlight selected, the largest node should turn yellow

- In this case we are going to create a sub tree based on the closest neighbours of our original strain. Press shift and drag the mouse to select those nodes nearest the one of interest. These nodes will turn red. Then press Filter Selected
- You will see that on the main page the table has been filtered to contain only those strains you have selected. Create another tree Analysis > Create Tree and give it an appropriate name
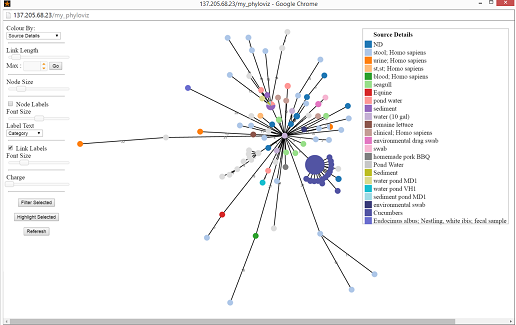
- Analyse the data further by changing the Colour By dropdown to different categories

By using the mouse wheel, you can zoom in and out of the tree and by dragging outside of any nodes, the position of the tree can be altered. Nodes can be coloured by metadata and labels shown hidden etc. as well as increasing/decreasing the length of the links or size of the nodes.
Link length is proportional to the number of differences between nodes. You can set a maximum using the max input underneath the Link length slider such that all links which have a greater value than that specified will be the same length (but the link will be a thin grey line to show that it is not proportional). This is helpful if you want to look at two or more clusters that are separated by long linkages.
The charge slider controls the repulsion between nodes, the default value is around 3. It can be decreased to 0, which will make the tree more stable, but nodes will tend to overlap more. Conversely it can be increased, which will separate clusters of nodes and make the tree easier to visualize, but be aware that the length of links may no longer be proportional to number of allele differences.
Updated