Wiki
Clone wikibnpy-dev / demos / GaussianToyData-FiniteMixtureModel-EM
Simple Gaussian Mixture Model on Toy Data
Goal
This demo walks you through a "Hello World" example of using bnpy from within Python.
We'll train a Gaussian mixture model using expectation maximization (EM). It should only take 30 seconds to produce a nice visualization.
Installation
Follow these instructions to make sure you've got bnpy and its dependencies installed correctly.
Throughout this demo (and other demos), we'll assume you successfully installed bnpy in a directory which is on your $PYTHONPATH.
We can use the following import statements to load bnpy.
import bnpy
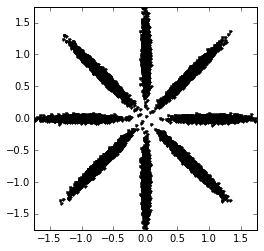
Toy dataset : AsteriskK8
We'll use a simple dataset of 2D points, drawn from 8 well-separated Gaussian clusters.
import AsteriskK8
Data = AsteriskK8.get_data()
We can visualize this dataset as follows:
from matplotlib import pylab
%pylab inline
Populating the interactive namespace from numpy and matplotlib
pylab.plot(Data.X[:,0], Data.X[:,1], 'k.');
pylab.gcf().set_size_inches(4, 4);
pylab.axis('image'); pylab.xlim([-1.75, 1.75]); pylab.ylim([-1.75, 1.75]);

Running inference with bnpy
We'll fit a \(K=8\) Gaussian mixture model to a simple toy dataset. Here's the code along with its output to stdout.
hmodel, RInfo = bnpy.run('AsteriskK8', 'FiniteMixtureModel', 'Gauss', 'EM', nLap=50, K=8)
Asterisk Toy Data. 8 true clusters.
  size: 25000 units (single observations)
  dimension: 2
Allocation Model:  Finite mixture with K=8. Dir prior param 1.00
Obs. Data  Model:  Gaussian with full covariance.
Obs. Data  Prior:  Gauss-Wishart on each mean/prec matrix pair: mu, Lam
  E[ mu[k] ]     = [ 0.  0.]
  E[ CovMat[k] ] =
  [[ 1.  0.]
   [ 0.  1.]]
Learn Alg: EM
Trial  1/1 | alg. seed: 4226944 | data order seed: 8541952
savepath: /results/AsteriskK8/defaultjob/1
        1/50 after      0 sec. | K    8 | ev -5.233448743e+06 |
        2/50 after      0 sec. | K    8 | ev -7.255537859e-01 | Ndiff    469.916
        3/50 after      0 sec. | K    8 | ev -4.881217375e-01 | Ndiff    838.469
        4/50 after      0 sec. | K    8 | ev -3.600440237e-01 | Ndiff    624.909
        5/50 after      0 sec. | K    8 | ev -1.504401133e-01 | Ndiff    382.469
        6/50 after      0 sec. | K    8 | ev -1.208708327e-02 | Ndiff    621.636
        7/50 after      0 sec. | K    8 | ev  1.924327448e-02 | Ndiff    434.059
        8/50 after      0 sec. | K    8 | ev  4.236480859e-02 | Ndiff    239.341
        9/50 after      1 sec. | K    8 | ev  7.086226579e-02 | Ndiff    108.915
       10/50 after      1 sec. | K    8 | ev  1.053270414e-01 | Ndiff     16.711
       11/50 after      1 sec. | K    8 | ev  1.084152629e-01 | Ndiff      0.708
       12/50 after      1 sec. | K    8 | ev  1.084158112e-01 | Ndiff      0.019
... done. converged.
That's it. bnpy.run is the function that runs experiments. It handles loading data, constructing models and applying learning algorithms.
Frequently Asked Questions
Where are results saved?
Model parameters will also be saved to a subdirectory of $BNPYOUTDIR.
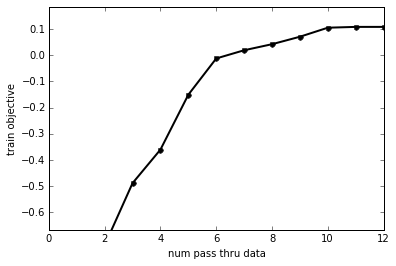
How do I plot the objective function over time?
Here, we plot the log evidence (sometimes called the evidence lower bound or ELBO).
bnpy.viz.PlotELBO.plotJobsThatMatchKeywords('AsteriskK8/defaultjob');

How do I plot the learned model parameters?
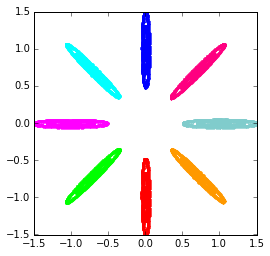
We can examine the resulting model parameters (means and covariances) using bnpy's built-in visualization tools.
Specifically, we can use the plotCompsForTask method to visualize the final result of this run.
bnpy.viz.PlotComps.plotCompsForTask('AsteriskK8/defaultjob/1/')

This creates a 2D plot of the 8 learned components (colored elliptical contours).
Each component's Gaussian pdf is shown as a contour plot, where lines represent contours of equal probability density. The contours of a Gaussian always form an ellipse.
Will the solution always be perfect?
No learning algorithm in bnpy is guaranteed to find the best solution. Instead, EM and variational inference are vulnerable to local optima. We think this is important to highlight from the first demo, to raise awareness of this issue.
Updated