
Visualise arbitary values from a filtered dataset
Issue #129
new
No description provided.
Comments (4)
-
reporter
-
reporter
-
reporter
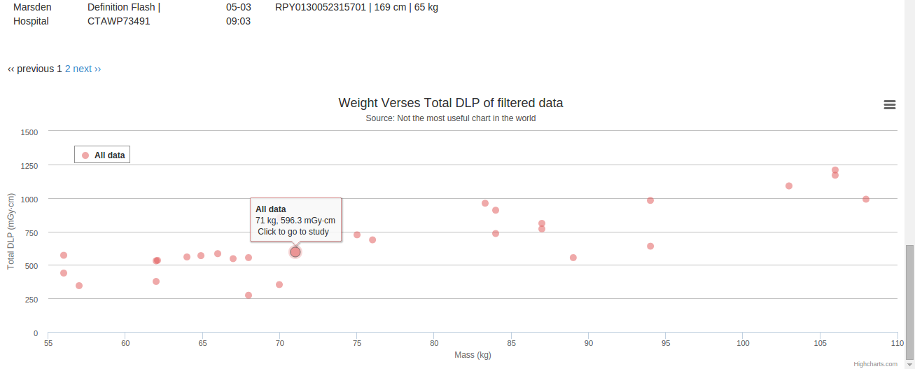
Inspired by DJP's histogram for DX, I've added a weight vs Total exam DLP scatter plot to the CT page. Clicking on any point takes you to the study details for that exam. Not very flexible, and doesn't actually show what I want to see, but exciting none-the-less. Refs
#5in https://bitbucket.org/dplatten/openrem-with-dx-import/issue/5 and refs #129 in https://bitbucket.org/openrem/openrem/issue/129/.→ <<cset 22e00294855b>>
-
The user could be given a choice of what to plot against what. We could put the patient size, age and weight fields in a drop-down options box on the page. When the user selects one then the data displayed on the plot is updated accordingly.
- Log in to comment
- Assignee
- –
- Type
- Priority
- Status
- new
- Component
- Interface: Data visualisation
- Milestone
- Future
- Votes
- 0
- Watchers
- 2

Inspired by DJP's histogram for DX in the dplatten/openrem-with-dx-import repository, I've added a weight vs Total exam DLP scatter plot to the CT page. Clicking on any point takes you to the study details for that exam. Not very flexible, and doesn't actually show what I want to see, but exciting none-the-less. Refs
#5in https://bitbucket.org/dplatten/openrem-with-dx-import/issue/5 and refs #129 in https://bitbucket.org/openrem/openrem/issue/129/.