Wiki
Clone wikiRUBA / Video Analysis
Analysis in RUBA
The procedure when conducting an analysis in RUBA is as follows:
- Import video(s)
- Create module(s) for the analysis
- Calibrate parameters to ensure that the right movements/road users are registered
- Run the analysis
Import of videos
RUBA handles videos of most file types and resolutions. The program offers two different approaches for handling the synchronisation and time management for every frame of a video file:
- If the frame rate of the video is constant, the start time of the video might be encoded into the file name of the video. The exact time of a frame will be computed based on the start time, the frame rate of the video, and the current frame number.
- If the frame rate of the video is varying, you may put the exact date and time of each frame in a separate logfile. The log file should be placed in the same directory as the corresponding video file and share the same filename except for the extension. As default, RUBA looks for corresponding files with the '.log' extension.
For more information on the video synchronisation options, see the Synchronisation section in the User Interface and Settings page.
Once you have selected a suitable way to ensure the synchronisation of the video, you have two options to import video files into RUBA:
- Use File -> Load Video Files or click the button at the menu bar (CTRL + O). This option will clear the current list of video files and import the new files that you have selected.
- Use the 'Add videos to list (CTRL + Ins)' button in the 'Video files' pane. This option will add the selected videos files to the bottom of the current list of video files.
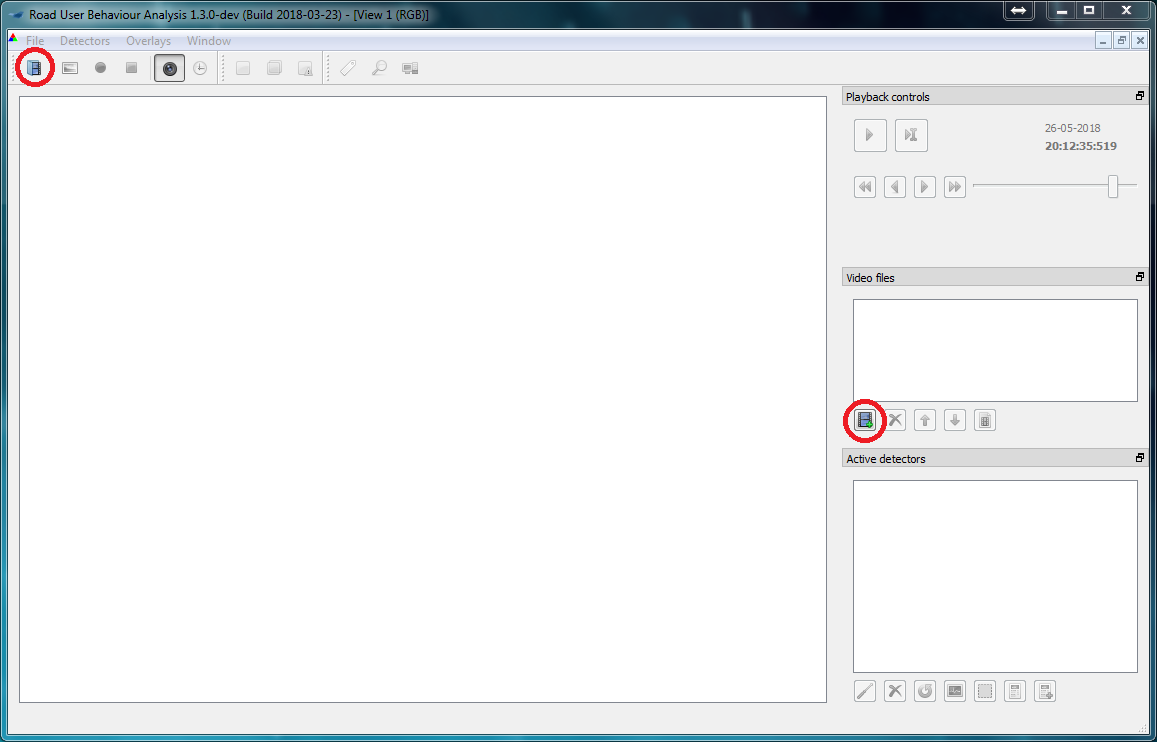
Figure | Import of videos is done via either of the two buttons
Creation of modules for the analysis
After the videos have been imported the first video is shown in the window pane. A module for the analysis is created by pressing the button for the desired module.
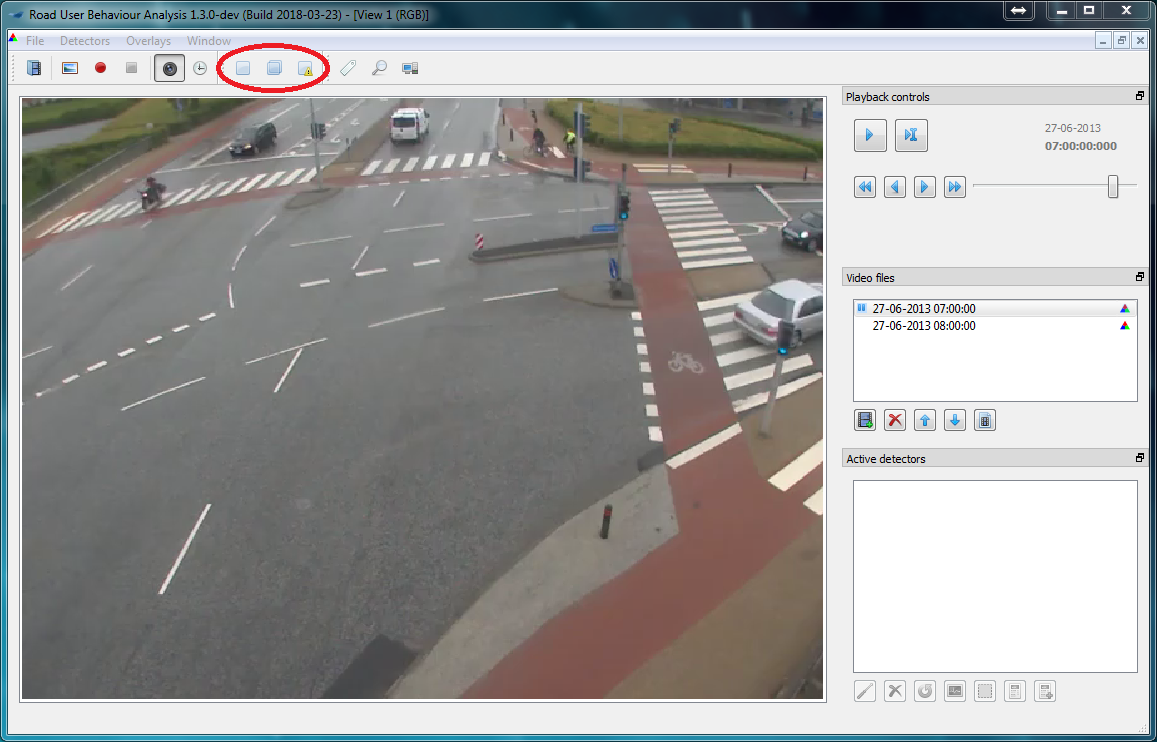
Figure | Creation of modules
Choose the desired detector type. Then press OK. A description of the different detectors is given in the detector types section.
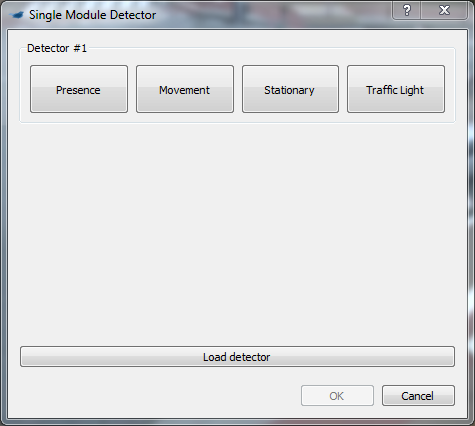
Figure | Choice of detector type in single module
Drawing the mask
After the desired detector have been chosen a new window opens. This window contains the settings of the detector and lets the user draw the detector. Via Configure detectors the detector is chosen, after which drawing tools to create the detector and a number of detector settings appears. The settings depend on the chosen detector type.
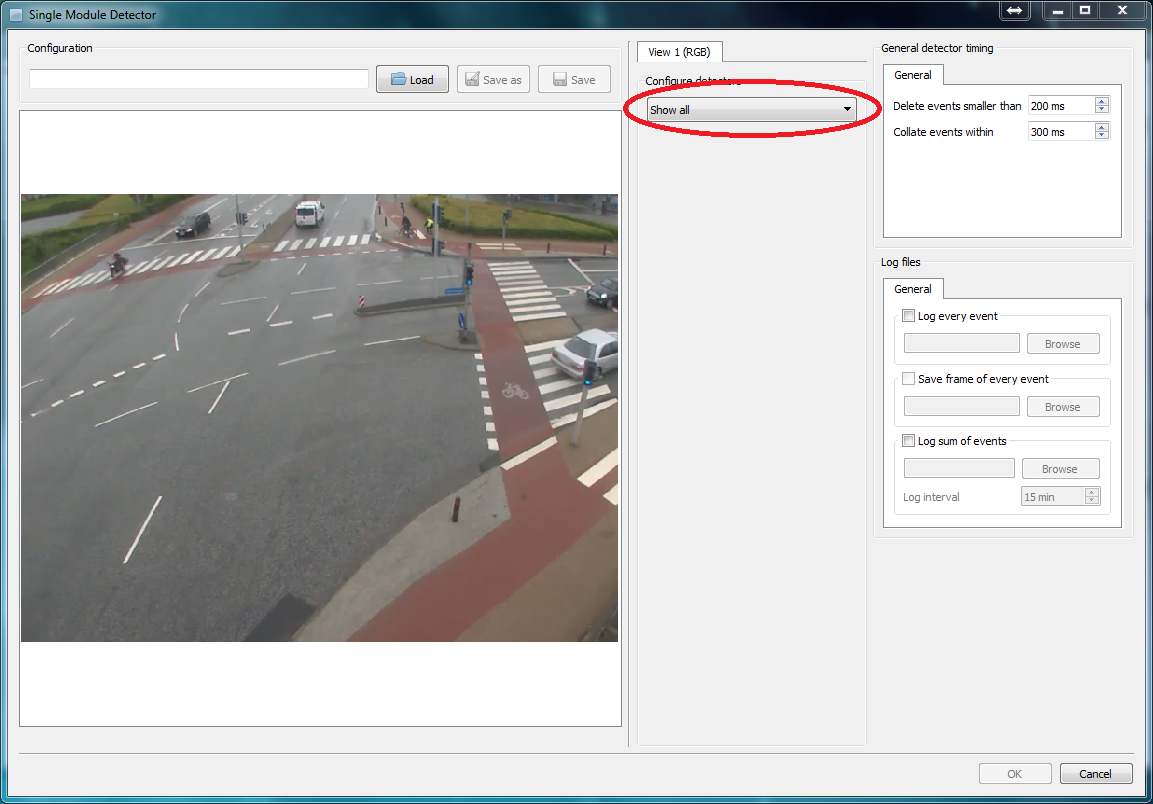
Figure | Creation of detectors
To draw the outline of the detector, click on the pencil. The detector is drawn by clicking in the image. Straight lines are created between the points. The latest point can be deleted by right clicking.
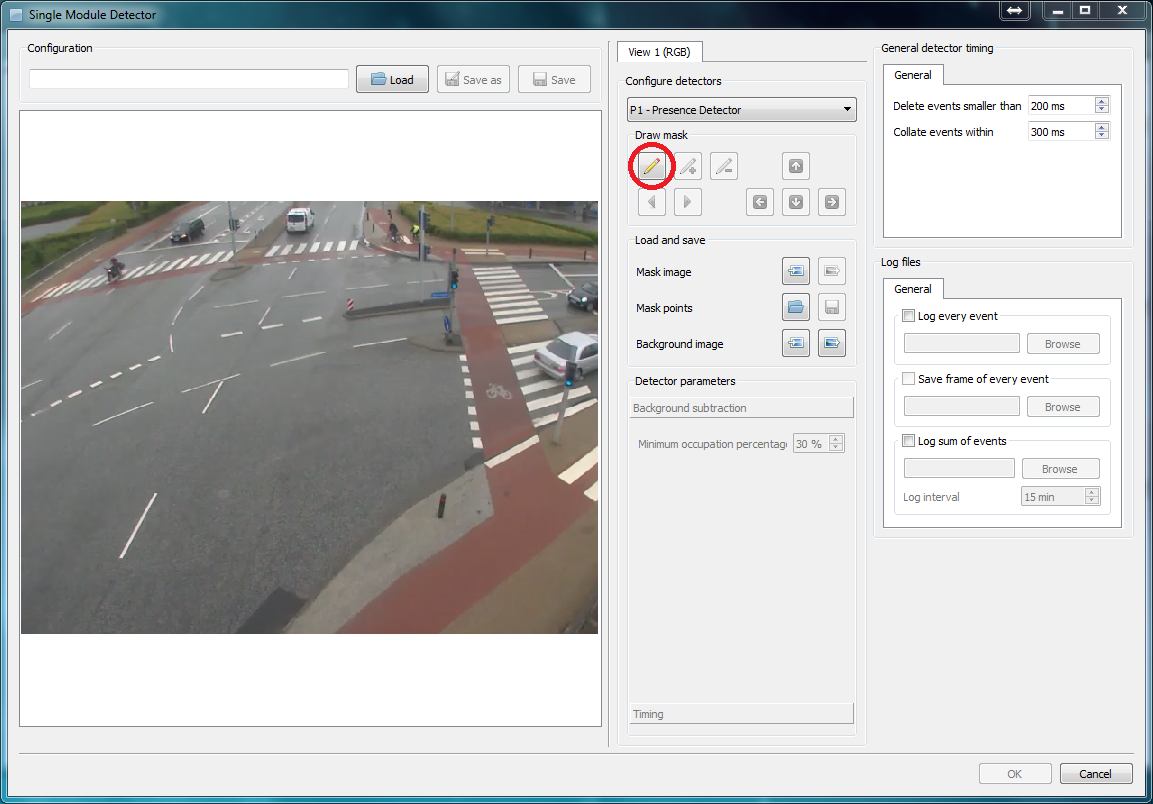
Figure | Drawing tools and settings for an presence detector
Drawing tips
Use the drawing tools to modify your detector:
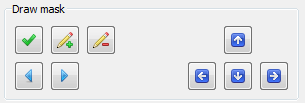
Button Description Remove the last corner point. Add a point between the current and the previous corner. Switch between corners. The current point is marked with a circle. Move the corner up/down/left/right. You can use keyboard shortcuts in RUBA. Hold your mouse over the buttons to find the keyboard shortcut.
Move points: When drawing your detector, you can click on the points and drag them to where you want them to be.
If you have an existing detector mask or want to save the mask area as an image or RUBA file, you can use the functionalities in the Load and save panel. Mask image loads (left) or saves (right) an image of the detector where the detector is white and the background is black. Mask points can be used to save a RUBA configuration file with information on the size and position of the detector. Background image imports and exports a screenshot of the background.
Figure | Load an existing detector mask or create images and detector masks to reuse the masks
Once the detector has been drawn (i.e. it only needs to be closed), double click or press the green tick mark. After this, the parameters can be adjusted, and it can be chosen if logs should be created Log every event and Log sum of events. See the dedicated page on log files and timing for detailed information on the log system of RUBA.
The detector is saved via the Save-button before the window is closed via the OK-button.
Configuration files that have previously been saved can similarly be imported in this window.
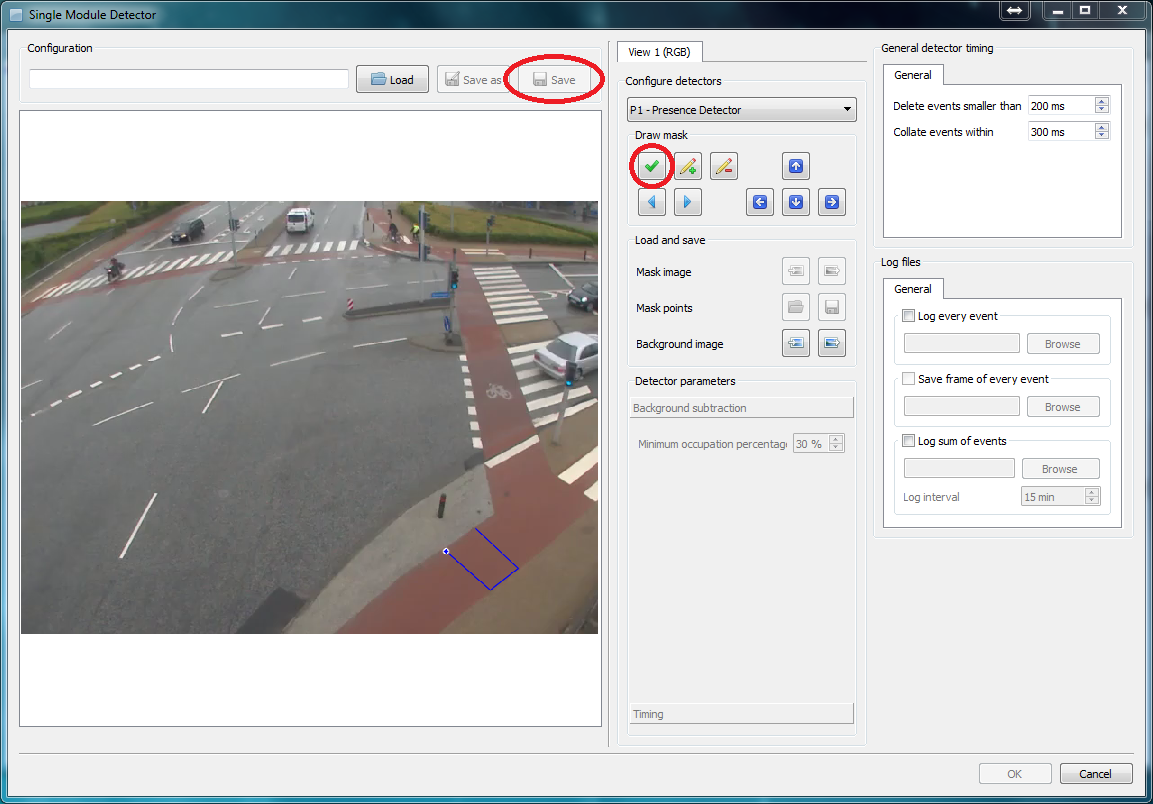
Figure | Creation of detector using the drawing tool
Calibration of parameters
To ensure that the right objects are detected the parameters must be calibrated. This is done via a number of tools which let the user gain insight into what is detected by the algorithms.
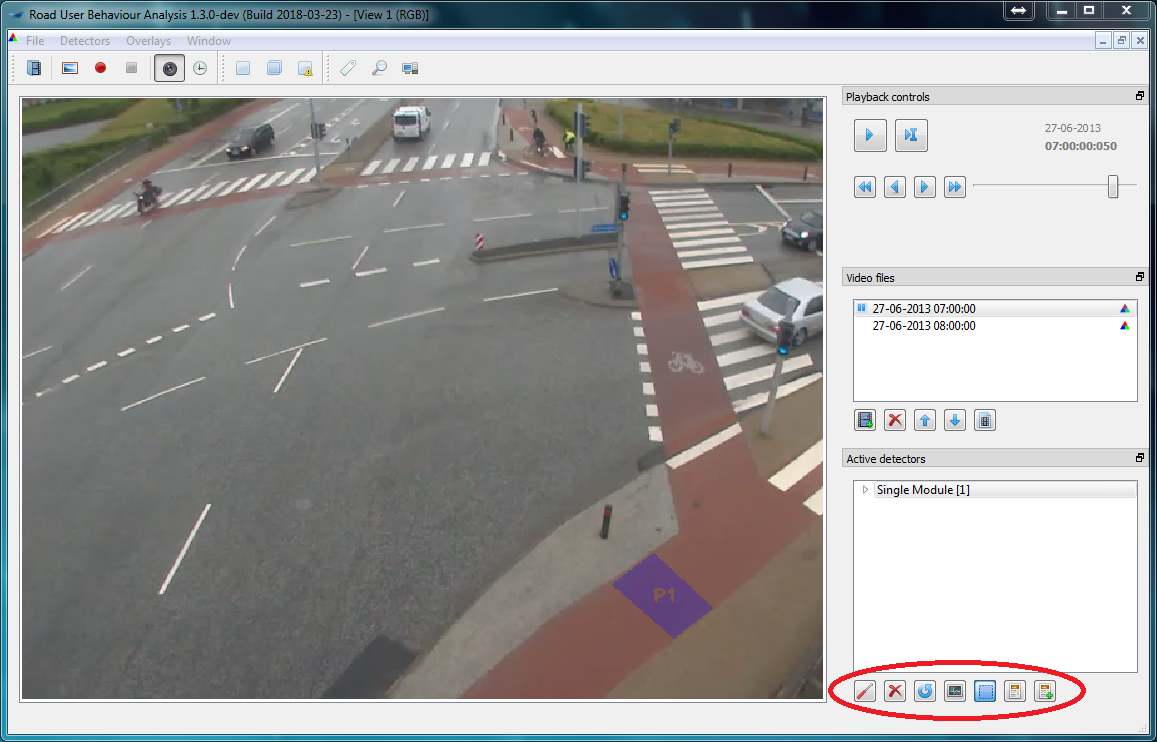
Figure | Tools for calibration of the detectors. From left: 1) edit the detector. Editing can also be done by right clicking on the detector in the Active detectors; window. 2) delete the marked detector. If the detector has not been saved, it is deleted completely and cannot be imported. 3) histograms. 4) Overlay of the detector in the image. 5) information about activity in the detector. 6) extended information about the detector
Histograms
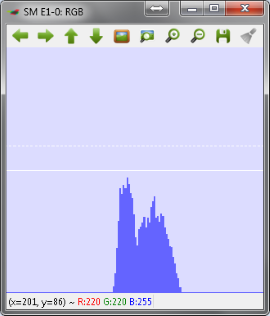
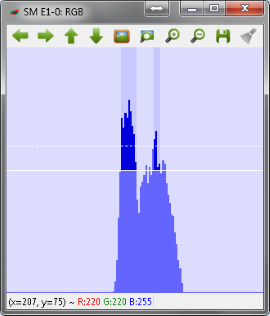
The most important tool for the calibration is the histograms of the activity in each detector.
Before calibration After calibration Histograms are used to adjust the detector. If the amount of activity is sufficiently high, so that the software recognizes it as a road user, the activity is marked with a bright colour (in this case blue). If the parameters of the detector are not adjusted correctly, then the road user will either be missed or only partly detected (left). After the adjustments of the parameters the road user will be clearly detected (right).
The histograms of the movement detector, the stationary detector, and the traffic light detector are described in more details in the detector types section.
When adjusting the detectors, change a few parameters at a time and validate experimentally if the change has any effect. The most important parameters of the detectors are listed below:
- Presence detector: Minimum occupation percentage
- Movement detector: Trigger threshold, movement range, and minimum speed
- Stationary detector: Minimum occupation percentage, minimum speed, and max vector count
- Traffic light detector: The position of the annotated traffic light positions
A detailed description of all detector parameters is given in the detector types section.
Detailed information on how to set up the logger is given in the log files and timing section. There, you will also find information on the timing options of the different detector modules.
Run the analysis
When the detectors have been calibrated the analysis can be performed. If it has not yet been specified which log files should be created during the analysis, this is done by double clicking the detector in active detectors.
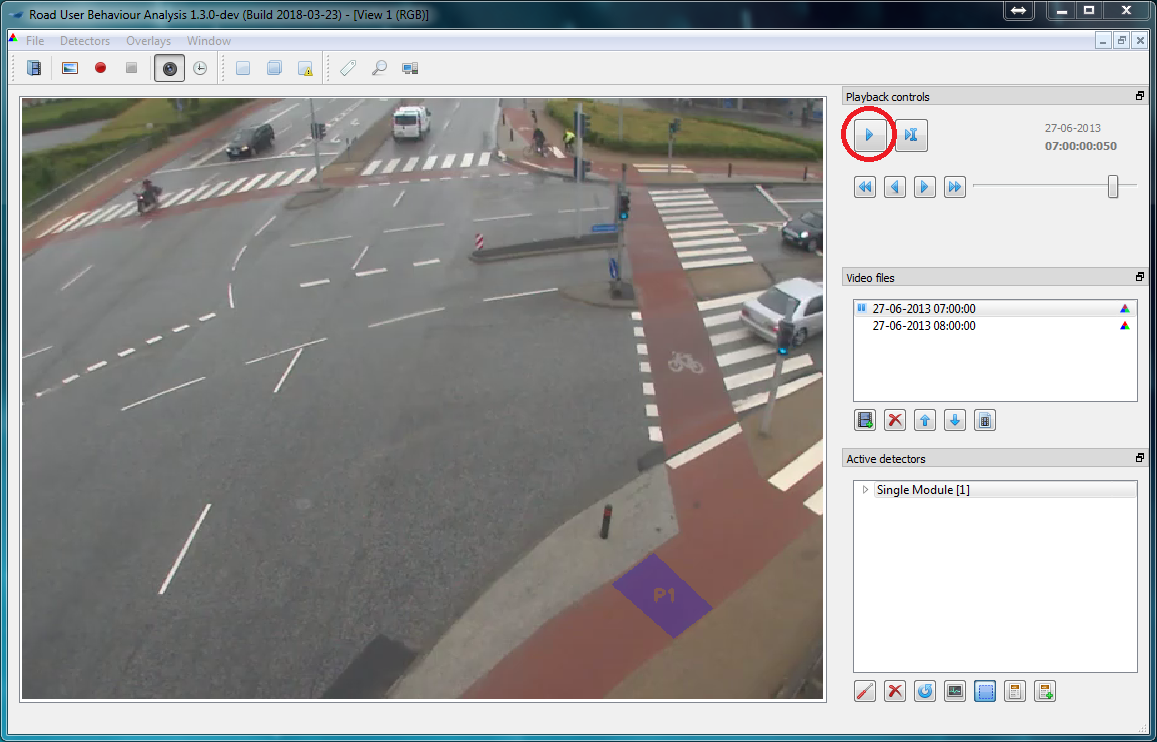
Figure | Running a traffic analysis. Double click on the first video to scroll back to the beginning of the video, and then press the play button to run the analysis. The analysis is complete when the time stops in the end of the last video. Please note, that the time and date must be specified in the beginning of each video if the user defined time format is used
Inspecting the log files
If log every event or log sum of events have been marked when configuring the detector, a number of log files (.csv-files) will be generated. The log files may be inspected by a text editor or a spreadsheet program such as Microsoft Excel. More details on the log system are provided in the log files and timing section.
Multi-threaded processing
It takes time to process long videos in RUBA, especially if the resolution of the video frames is high. In order to help with this problem, RUBA has an option to split the analysis such that it runs on multiple threads. Once the videos are loaded and the detectors are initialised, press the Perform multi-threaded processing button in the main menu.

Figure | Opening the Multi-threaded processing dialogue.
Once you have opened the multi-threaded processing dialogue, you may select the desired number of threads to perform the analysis. The maximum number of threads is dependent on the number of physical CPU-cores on your machine. Furthermore, in order to create a number of threads, each tread needs at least one unique video.
In the example below, RUBA has detected that the machine has eight CPU-cores, but RUBA only allows the creation of four threads because only four video files are loaded. In order to increase the number of threads, more video files should be provided and the multi-threaded processing dialogue should be reopened.
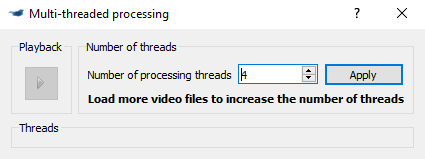
Figure | The initial window in the Multi-threaded processing dialogue.
The optimal number of processing threads
The maximum number of threads is computed as the number of CPU-cores, minus 1. If the computer has four CPU-cores, three will be selected for running the analysis - and the last will be spared for showing the progress in RUBA and for running other tasks.
As a general rule, the processing speed is proportional to the number of processing threads. However, if your CPU features hyper-threading technology, RUBA will typically see one physical CPU-cores as two CPU-cores. On a machine that has four physical CPU-cores with hyper-threading, RUBA will report the maximum number of threads to
4 * 2 - 1 = 7, seven threads. In this case, the addition of more threads than physical CPU-cores will have little impact on performance.
Once you have selected the desired number of processing threads, press the Apply button. Behind the scenes, RUBA will save the detectors and reload them for every thread. This might take some seconds depending on the number of threads and the size of the detectors. After this process has finished, the window will be resized and the desired number of threads are shown. Press the Play button in the upper left corner to start processing.

Figure | The multi-threaded processing is started.
The Video Files window shows the progress of the analysis. As opposed to normal analysis, it is not possible to jump to a specific video by double-clicking.
The Detectors window allows you to inspect the progress by expanding the arrows, similar to a normal analysis. However, the following features are not supported when the multi-processing window is opened:
- Reconfiguring detectors
- Showing the detector masks
- Showing the detector histograms
- Overlaying debug information on the videos
Because the analysis now runs in parallel, you will find that RUBA creates temporary log files, one for each thread. Once all the threads has finished processing, RUBA will automatically combine the temporary log files into a single log file.
Updated
