Wiki
Clone wikiRUBA / all
Doc info #
Revision chart
TOC
Executive summary
Introduction
The Road User Behaviour Analysis (RUBA) project is a watch-dog tool for computer-based analysis of traffic videos. The program can be used on Windows, MacOS, and Linux computers.
RUBA is developed by the Visual Analysis of People Lab at Aalborg University, Denmark, in collaboration with the Traffic Safety Research Group at Aalborg University.
RUBA allows the user to draw fields (detectors) on the video image by using a simple click-based drawing tool. The sensitivity of the detector, regarding movement in the image, is adjusted by different parameters in the program.

Figure | The RUBA logo
How to contribute
Please feel free to use RUBA and see if it fits your use case and research needs. If you encounter a bug by doing so, or if you have any suggestions on the further improvement of RUBA, please report it in our issue tracker.
License
RUBA is licensed under the MIT License.
Analysis in RUBA
The procedure when conducting an analysis in RUBA is as follows:
- Import video(s)
- Create module(s) for the analysis
- Calibrate parameters to ensure that the right movements/road users are registered
- Run the analysis
Import of videos
RUBA handles videos of most file types and resolutions. The program offers two different approaches for handling the synchronisation and time management for every frame of a video file:
- If the frame rate of the video is constant, the start time of the video might be encoded into the file name of the video. The exact time of a frame will be computed based on the start time, the frame rate of the video, and the current frame number.
- If the frame rate of the video is varying, you may put the exact date and time of each frame in a separate logfile. The log file should be placed in the same directory as the corresponding video file and share the same filename except for the extension. As default, RUBA looks for corresponding files with the '.log' extension.
For more information on the video synchronisation options, see the Synchronisation section in the User Interface and Settings page.
Once you have selected a suitable way to ensure the synchronisation of the video, you have two options to import video files into RUBA:
- Use File -> Load Video Files or click the button at the menu bar (CTRL + O). This option will clear the current list of video files and import the new files that you have selected.
- Use the 'Add videos to list (CTRL + Ins)' button in the 'Video files' pane. This option will add the selected videos files to the bottom of the current list of video files.
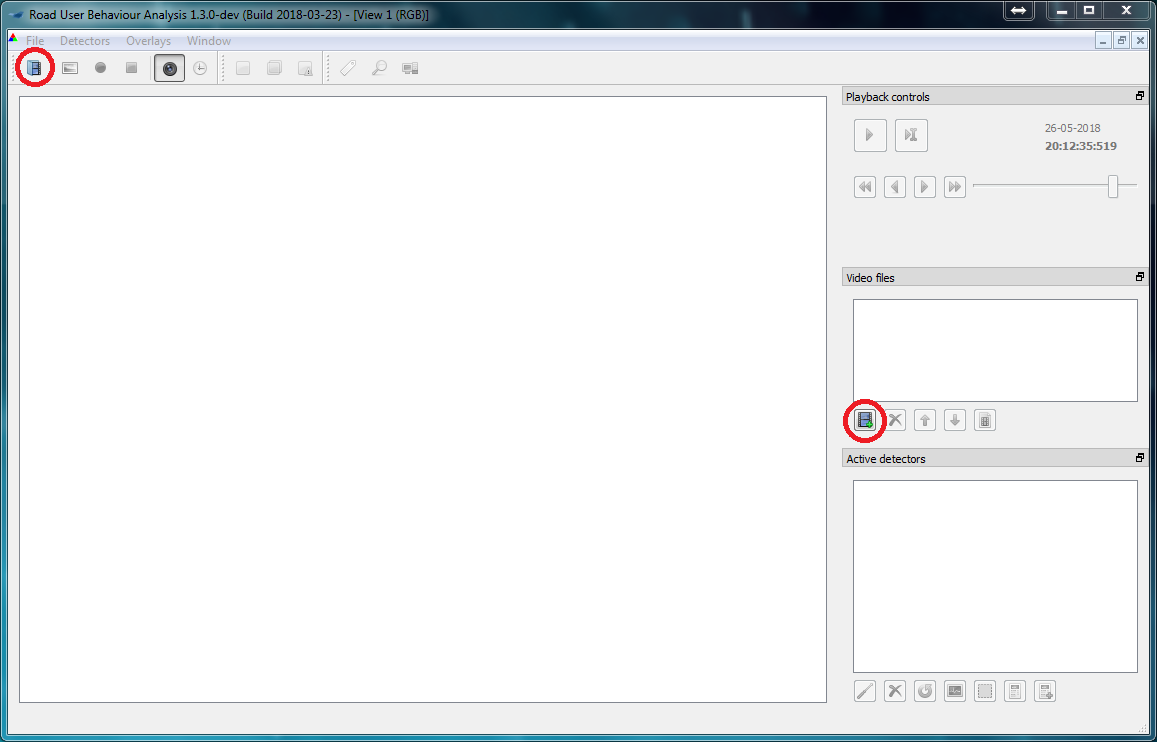
Figure | Import of videos is done via either of the two buttons
Creation of modules for the analysis
After the videos have been imported the first video is shown in the window pane. A module for the analysis is created by pressing the button for the desired module.
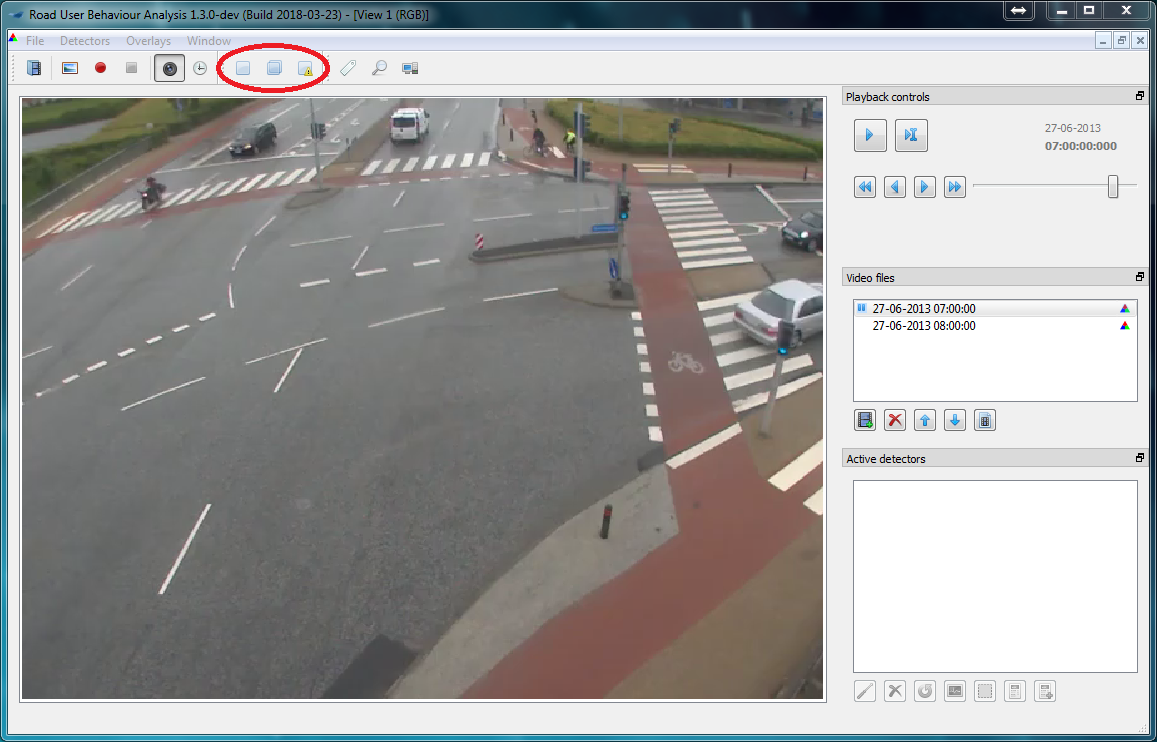
Figure | Creation of modules
Choose the desired detector type. Then press OK. A description of the different detectors is given in the detector types section.
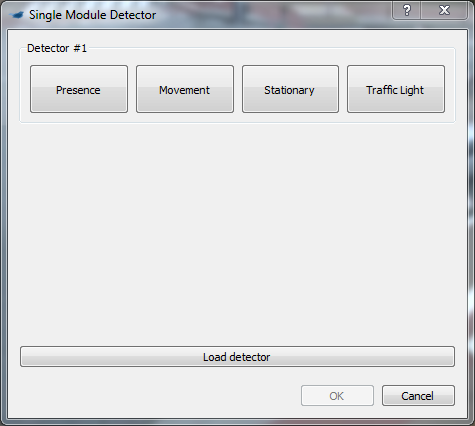
Figure | Choice of detector type in single module
Drawing the mask
After the desired detector have been chosen a new window opens. This window contains the settings of the detector and lets the user draw the detector. Via Configure detectors the detector is chosen, after which drawing tools to create the detector and a number of detector settings appears. The settings depend on the chosen detector type.
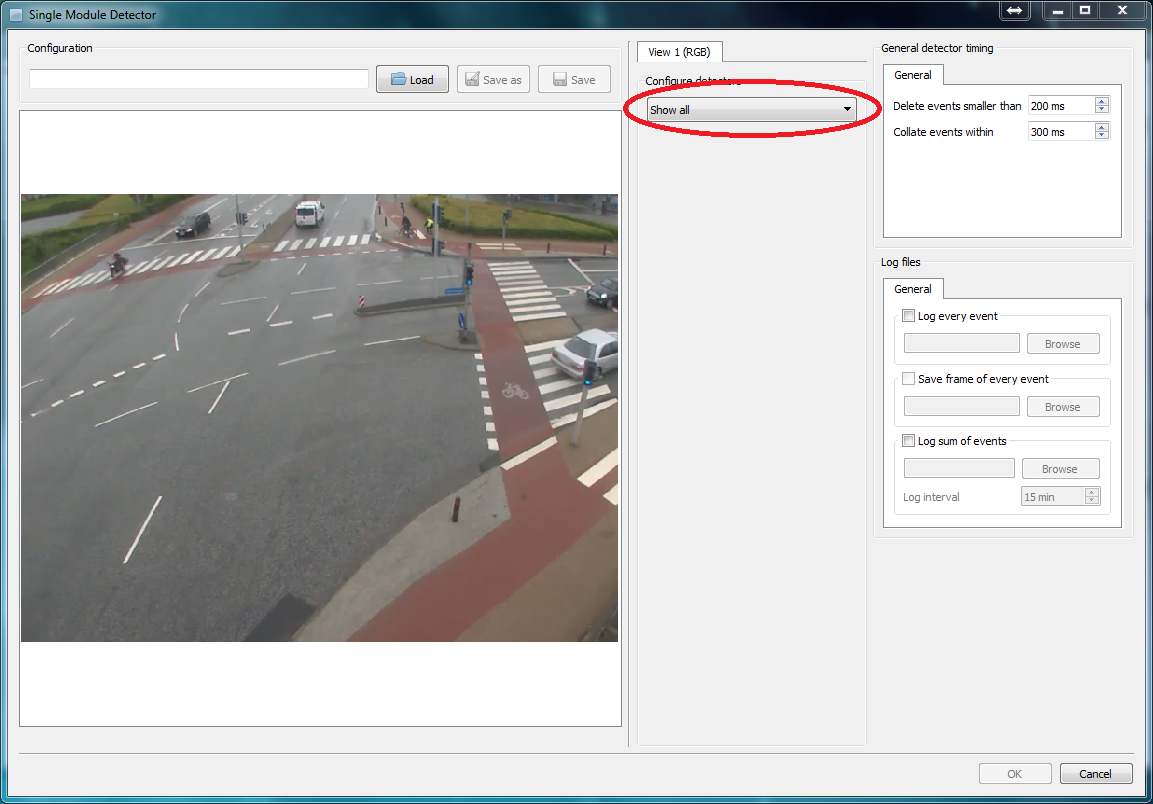
Figure | Creation of detectors
To draw the outline of the detector, click on the pencil. The detector is drawn by clicking in the image. Straight lines are created between the points. The latest point can be deleted by right clicking.
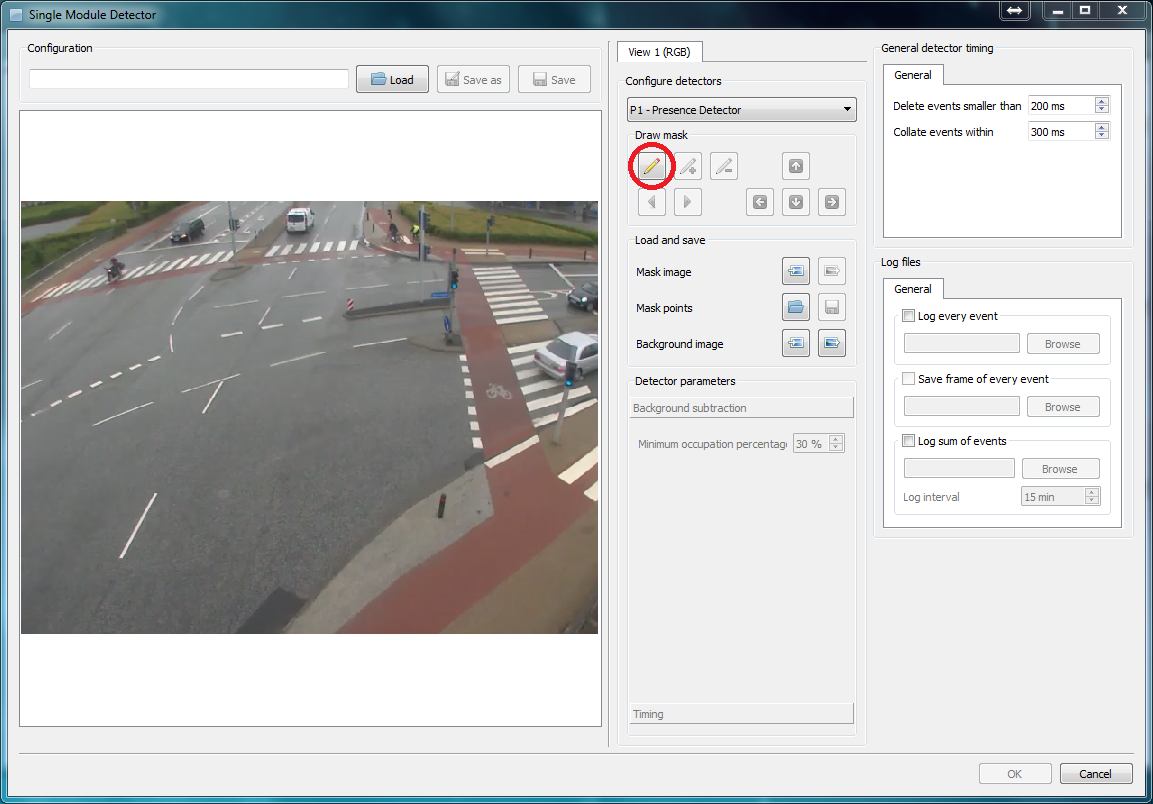
Figure | Drawing tools and settings for an presence detector
Drawing tips
Use the drawing tools to modify your detector:
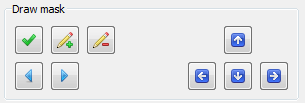
Button Description Remove the last corner point. Add a point between the current and the previous corner. Switch between corners. The current point is marked with a circle. Move the corner up/down/left/right. You can use keyboard shortcuts in RUBA. Hold your mouse over the buttons to find the keyboard shortcut.
Move points: When drawing your detector, you can click on the points and drag them to where you want them to be.
If you have an existing detector mask or want to save the mask area as an image or RUBA file, you can use the functionalities in the Load and save panel. Mask image loads (left) or saves (right) an image of the detector where the detector is white and the background is black. Mask points can be used to save a RUBA configuration file with information on the size and position of the detector. Background image imports and exports a screenshot of the background.
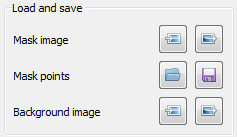
Figure | Load an existing detector mask or create images and detector masks to reuse the masks
Once the detector has been drawn (i.e. it only needs to be closed), double click or press the green tick mark. After this, the parameters can be adjusted, and it can be chosen if logs should be created Log every event and Log sum of events. See the dedicated page on log files and timing for detailed information on the log system of RUBA.
The detector is saved via the Save-button before the window is closed via the OK-button.
Configuration files that have previously been saved can similarly be imported in this window.
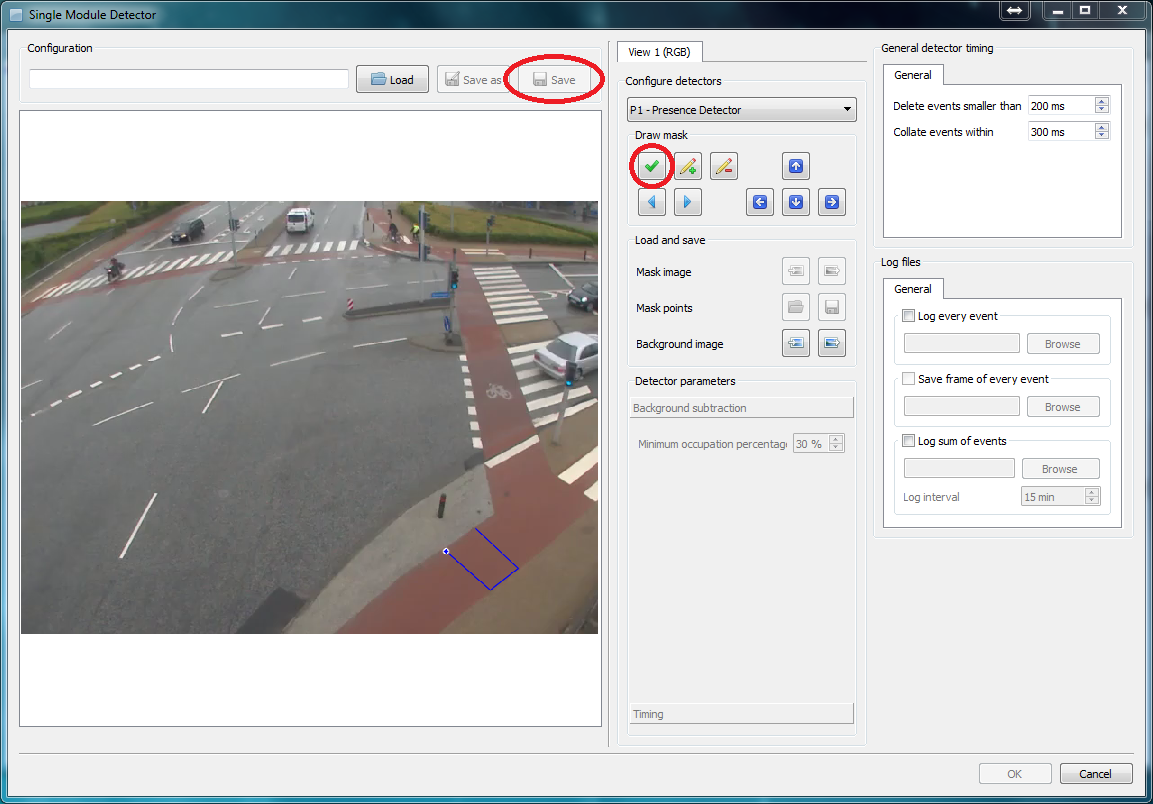
Figure | Creation of detector using the drawing tool
Calibration of parameters
To ensure that the right objects are detected the parameters must be calibrated. This is done via a number of tools which let the user gain insight into what is detected by the algorithms.
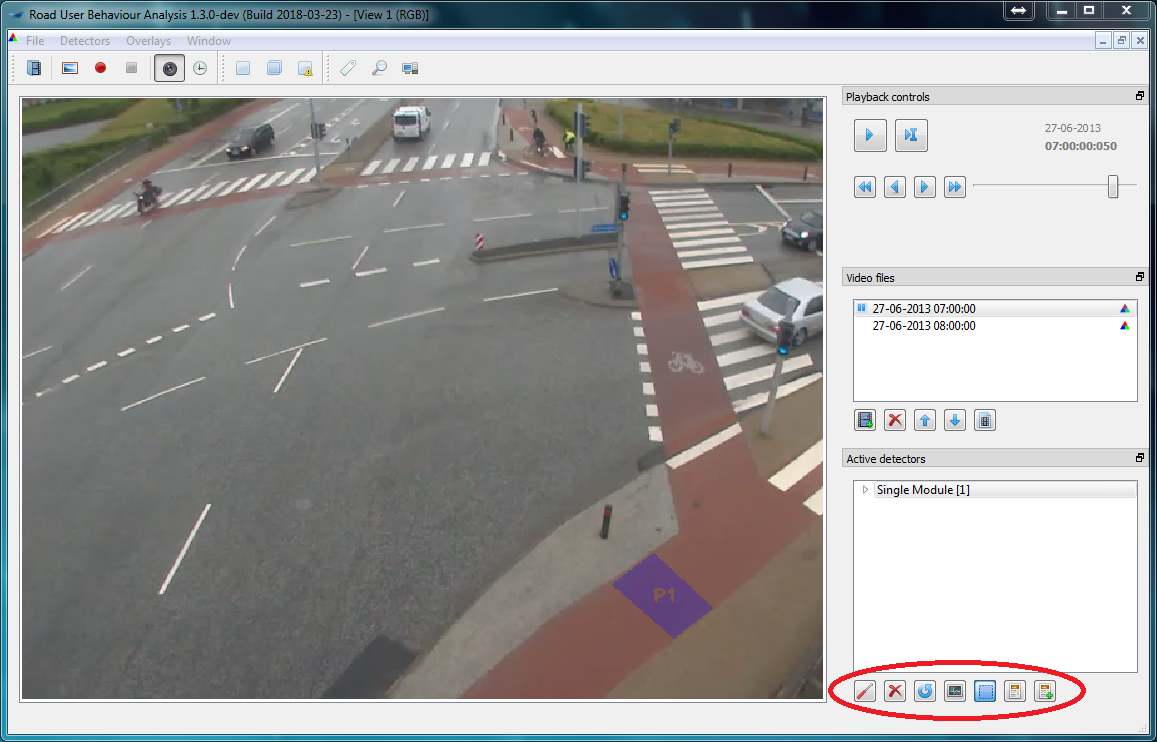
Figure | Tools for calibration of the detectors. From left: 1) edit the detector. Editing can also be done by right clicking on the detector in the Active detectors; window. 2) delete the marked detector. If the detector has not been saved, it is deleted completely and cannot be imported. 3) histograms. 4) Overlay of the detector in the image. 5) information about activity in the detector. 6) extended information about the detector
Histograms
The most important tool for the calibration is the histograms of the activity in each detector.
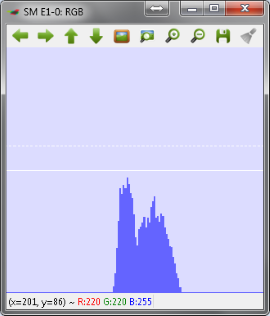
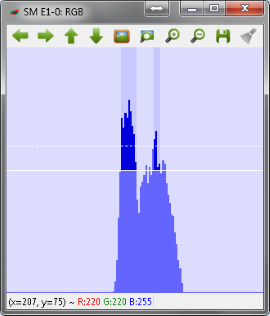
Before calibration After calibration Histograms are used to adjust the detector. If the amount of activity is sufficiently high, so that the software recognizes it as a road user, the activity is marked with a bright colour (in this case blue). If the parameters of the detector are not adjusted correctly, then the road user will either be missed or only partly detected (left). After the adjustments of the parameters the road user will be clearly detected (right).
The histograms of the movement detector, the stationary detector, and the traffic light detector are described in more details in the detector types section.
When adjusting the detectors, change a few parameters at a time and validate experimentally if the change has any effect. The most important parameters of the detectors are listed below:
- Presence detector: Minimum occupation percentage
- Movement detector: Trigger threshold, movement range, and minimum speed
- Stationary detector: Minimum occupation percentage, minimum speed, and max vector count
- Traffic light detector: The position of the annotated traffic light positions
A detailed description of all detector parameters is given in the detector types section.
Detailed information on how to set up the logger is given in the log files and timing section. There, you will also find information on the timing options of the different detector modules.
Run the analysis
When the detectors have been calibrated the analysis can be performed. If it has not yet been specified which log files should be created during the analysis, this is done by double clicking the detector in active detectors.
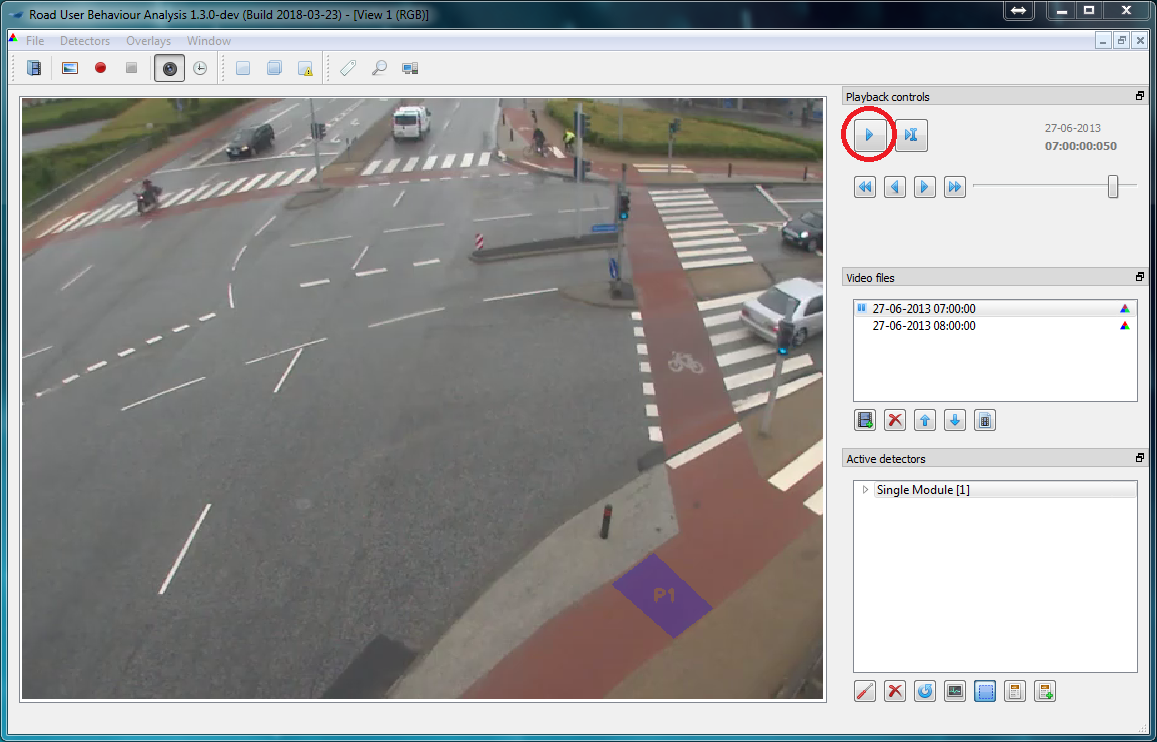
Figure | Running a traffic analysis. Double click on the first video to scroll back to the beginning of the video, and then press the play button to run the analysis. The analysis is complete when the time stops in the end of the last video. Please note, that the time and date must be specified in the beginning of each video if the user defined time format is used
Inspecting the log files
If log every event or log sum of events have been marked when configuring the detector, a number of log files (.csv-files) will be generated. The log files may be inspected by a text editor or a spreadsheet program such as Microsoft Excel. More details on the log system are provided in the log files and timing section.
Multi-threaded processing
It takes time to process long videos in RUBA, especially if the resolution of the video frames is high. In order to help with this problem, RUBA has an option to split the analysis such that it runs on multiple threads. Once the videos are loaded and the detectors are initialised, press the Perform multi-threaded processing button in the main menu.

Figure | Opening the Multi-threaded processing dialogue.
Once you have opened the multi-threaded processing dialogue, you may select the desired number of threads to perform the analysis. The maximum number of threads is dependent on the number of physical CPU-cores on your machine. Furthermore, in order to create a number of threads, each tread needs at least one unique video.
In the example below, RUBA has detected that the machine has eight CPU-cores, but RUBA only allows the creation of four threads because only four video files are loaded. In order to increase the number of threads, more video files should be provided and the multi-threaded processing dialogue should be reopened.
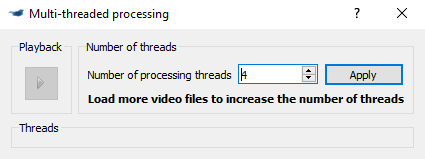
Figure | The initial window in the Multi-threaded processing dialogue.
The optimal number of processing threads
The maximum number of threads is computed as the number of CPU-cores, minus 1. If the computer has four CPU-cores, three will be selected for running the analysis - and the last will be spared for showing the progress in RUBA and for running other tasks.
As a general rule, the processing speed is proportional to the number of processing threads. However, if your CPU features hyper-threading technology, RUBA will typically see one physical CPU-cores as two CPU-cores. On a machine that has four physical CPU-cores with hyper-threading, RUBA will report the maximum number of threads to
4 * 2 - 1 = 7, seven threads. In this case, the addition of more threads than physical CPU-cores will have little impact on performance.
Once you have selected the desired number of processing threads, press the Apply button. Behind the scenes, RUBA will save the detectors and reload them for every thread. This might take some seconds depending on the number of threads and the size of the detectors. After this process has finished, the window will be resized and the desired number of threads are shown. Press the Play button in the upper left corner to start processing.

Figure | The multi-threaded processing is started.
The Video Files window shows the progress of the analysis. As opposed to normal analysis, it is not possible to jump to a specific video by double-clicking.
The Detectors window allows you to inspect the progress by expanding the arrows, similar to a normal analysis. However, the following features are not supported when the multi-processing window is opened:
- Reconfiguring detectors
- Showing the detector masks
- Showing the detector histograms
- Overlaying debug information on the videos
Because the analysis now runs in parallel, you will find that RUBA creates temporary log files, one for each thread. Once all the threads has finished processing, RUBA will automatically combine the temporary log files into a single log file.
User interface
The figure below illustrates the main window of RUBA, after a video has been imported. Until then, most buttons are inactive. In the following, the function of each button is described. Keyboard short-cuts are defined in square brackets.
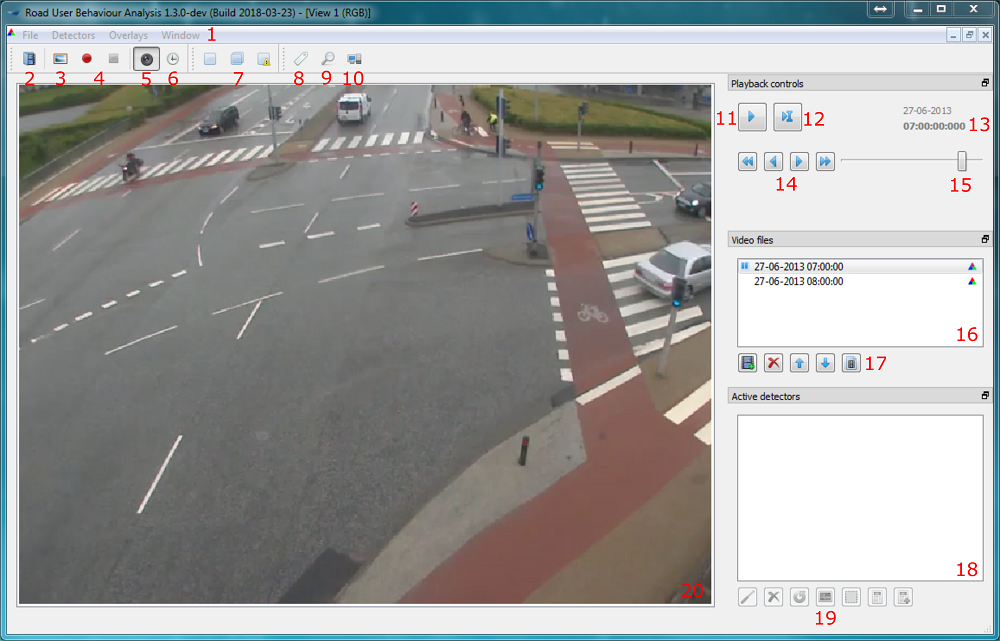
Figure | User interface shown when one or several videos have been imported
- Main menu. In the tabs, the same functions that are accessible via buttons in the main window can be found, as well as a number of program settings to use before conducting the analysis.
- Import video(s) [Ctrl + O].
- Take a screenshot of the video pane (20) [F9].
- Record a video of the video pane. Clicking the red dot [F10] starts the recording. It is possible to pause the recording by clicking the button again. The recording can be resumed by clicking the red button again. When clicking the square button [ctrl + F10] the recording is finished. All overlays (detectors, etc.) which are shown in the video pane (20) will appear in the recording.
- Enable/disable that the video is shown in the video pane (20) [F3].
- Add/remove overlay which shows a timestamp (13) in the video [F4].
- Flexible analysis tool (detector) consisting of a single module (left) [Ctrl+1], a double module (middle) [Ctrl+2] and an exclusive module (right) [ctrl+2].
- Annotate Ground Truth. Opens the
Ground Truth Annotatorpanel which can be used to manually detect activity. These detections can be used to calibrate detectors. - Review Log Files. Opens the
Log File Reviewerpanel which can be used to review events from a log file and create a new log file with selected events. - Multi-Threaded Processing. Press this button to open the
Multi-Threaded Processingpanel and analyse the videos in multiple thread simultaneously to speed up the analysis. - Start/pause analysis [space].
- Jump to a specific frame in the video.
- Date and time for the video.
- Navigate through the video. Use these four buttons to respectively jump five frames previous [A], one frame previous [S], one frame forward [D] and five frames forward [F].
- Adjust video speed. When the slider is placed to the far left the video is paused. When the slider is placed to the far right the video is sped to the maximum.
- Imported videos. The video that is currently played is marked with a pause symbol.
- Respectively add videos [Ctrl+insert], delete imported videos [Ctrl+del], change the order of the videos [ctrl+arrow up] and [ctrl+arrow down] and show the video properties. The button to the far right contains properties for the video (start/end time, frame rate, file name and resolution).
- Inserted/created detectors.
- Support tools for creating and calibrating of detectors. From left: 1) edit the detector [ctrl+R]. 2) delete the marked detector [Del]. 3) reset the detector. 4) histograms [F5]. 5) Overlay of the detector in the image [F6]. 6) information about activity in the detector [F7]. 7) extended information about the detector [F8].
- Video pane.
Settings
Access the settings under File -> Settings.

Figure | The settings panel in RUBA. The Debug panel is only shown when running a development version of RUBA.
General
- Restore previous configuration when the program starts: When you open RUBA it will try to load the videos that you imported the last time you were running RUBA. You can change this behaviour or choose to also load the detectors from the last time you were running RUBA.
- An alternative is to use the
Load configurationandSave current configurationbuttons in theFilemenu. A configuration file is, similar to the detector files, an .yml-file, but contains references to the videos and detectors that are currently loaded into RUBA. By using this functionality, you can quickly switch between different combinations of videos and detectors.
- An alternative is to use the

Figure | The general settings in RUBA.
Video synchronisation
-
Start time of each video is encoded in the file name: If the frame rate of the video is constant, the start time of the video might be encoded into the file name of the video. The exact time of a frame will be computed based on the start time, the frame rate of the video, and the current frame number.
- Frame rate: Used to define the frame rate. The value should match the frame rate of which the video is recorded. It is recommended to let RUBA auto-detect the frame rate (default).
-
Date and time: Used to define the date and time of which the video is recorded. This can be encoded in the file name, so that the information can be imported automatically. The format is chosen as either:
MM-dd-HH(month-day-hour). The year must be specified manually when playing the video.yyyy-MM-dd(year-month-day)yyyyMMdd-HH(year-month-day-hour)yyyy-MM-dd-HH(year-month-day-hour)yyyyMMdd-HH-mm-ss(year month day-hour-minute-second)yyyyMMdd-HH-mm-ss.zzz(year month day-hour-minute-second.millisecond)user definedin which the date and time is specified manually every time the video is played from the beginning.
-
Time stamps of each video frame are provided in a separate log file: If the frame rate of the video is varying, you may put the exact date and time of each frame in a separate log file. The log file should be placed in the same directory as the corresponding video file and share the same file name except for the extension.
- As default, RUBA looks for corresponding files with the '.log' extension. You may change this if necessary.
- Each line of the log file should be contain the frame number and the frame time in the following format:
frameNbr yyyy MM dd hh:mm:ss.zzz
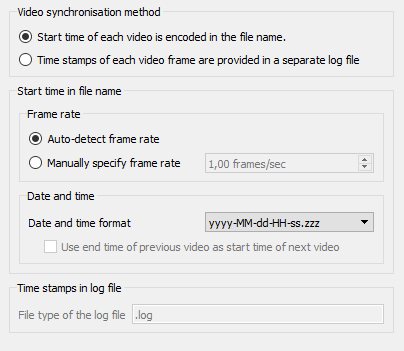
Figure | The synchronisation settings in RUBA.
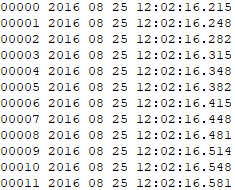
Figure | A sample log file containing time stamps for every individual frame
Processing
- Playback speed: Used to decide the speed of which the video will be analysed. The speed can be altered later on.
- Skip frames: In order to speed up processing, RUBA may skip every n'th frame. Beware, however, that this may the accuracy of the detectors.
- Resolution: Used to create a warning if the imported video is recorded at a low resolution. The width and height of when the warning is created can be set manually.
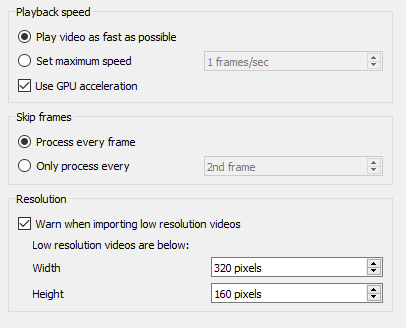
Figure | The processing settings in RUBA.
Recording
The behaviour of the built-in video recording may be altered from this settings. As default, RUBA records to a single file when the Record video to file button is pressed. However, when log files are played back with the Log File Reviewer, it might be beneficial to create a separate recording for each event.
If the option Create a new recording for each jump of at least is selected, a new recording will be created when the jump to frame functionality is used, either directly or indirectly from the Log File Reviewer. If this option is unchecked, a single video file will be created that contains the same 'jumps' as the original playback from RUBA.

Figure | The recording settings in RUBA.
Detector Types
The algorithm behind the software consists of four detector types (presence, movement, stationary, and traffic light) with different attributes. Examples of the application of the four detector types are shown in the table below.
Table | Applications of the detectors
| Detector | Description |
|---|---|
| Presence | Simple analysis and traffic counts. Traffic counts in sections. NB! The highest accuracy is obtained if the traffic streams are separated. |
| Movement | Analysis and traffic counts in areas shared by road users from different directions (e.g. in intersections). Road users driving in the opposite direction of travel. |
| Stationary | Analysis of road users that do not move. Detection of parked cars. |
| Traffic light | Analysis of the phases of one or several traffic lights. Combined with other detectors, analysis of red light running. |
Combinations of the detectors are introduced on the Detector modules page.
An overview of the adjustable parameters for each detector type is given below. A detailed description of the parameters is given with the overall description of each detector type.
Table | Adjustable parameters in the detector modules.
| Presence | Movement | Stationary | |
|---|---|---|---|
| Trigger threshold | x | ||
| Minimum occupation percentage | x | x | |
| Minimum speed | x | x | |
| Movement direction | x | ||
| Max vector count | x | ||
| Max triggered duration | x | x | x |
Presence Detector
The presence detector checks if there is an object in a specific area of the video. With this method objects (vehicles, road users) that are not a part of the background (the road, the surroundings) are extracted. This is done by converting the image to a gray scale image and finding presences (continuous lines), where large variations in the contrast appear. In this way the algorithm finds road markings, changes in the pavement, and road users. This is done for all the frames of the video. For two consecutive frames, vectors between the lines are created and summed up. In this way we get a measure for the activity which is based partly on the size of the object, partly on the speed of the object moving across the area. In order to take noise in the image into consideration; i.e. from small changes in the contract, birds, movement of leaves, or shadows, the sensitivity of the presence detector is controlled by some parameters. The background is updated regularly to extract elements that are consistent in the image for a long time, or elements that occur due to changes in the light conditions and the creation of shadows.
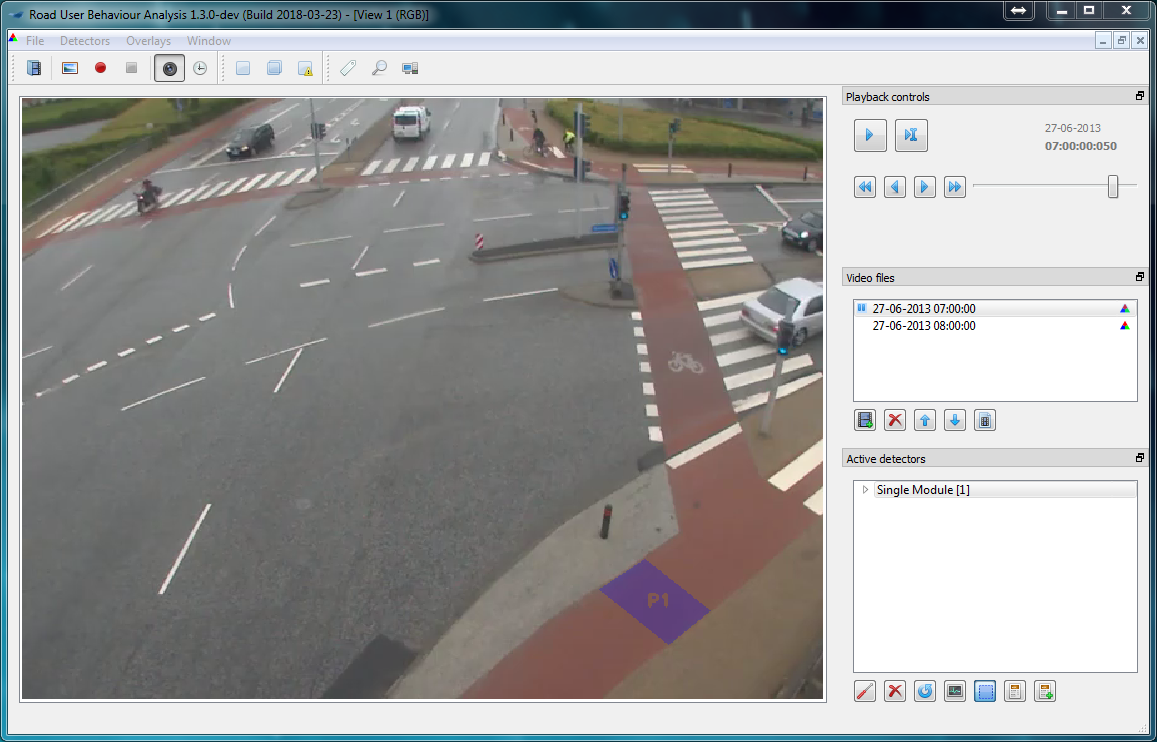
Figure | The presence detector (blue)
Presence detector histogram
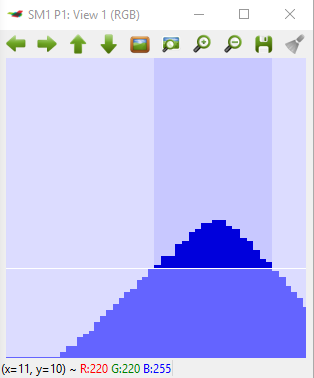
X-axis: time
Y-axis: registered occupation percentage, in the range from 0 to 100.
The lower white, horizontal line shows if the size of the object that is present inside the detector is lower or higher than the Minimum occupation percentage.
To be detected as a road user, the blue lines must go higher than the horizontal line and the width of the blue lines above the threshold must be above the time interval which is defined in Delete events smaller than (standard setting: 200 ms). Only the dark blue lines counts in the time that it should be above the threshold to be detected as a road user. The width of the dark blue part should be approx. 0.5 cm when using the standard setting of 200 ms. If the activity for one road user results in two tops with a small gap in between (meaning that it will be registered twice), you can adjust the value for Collate events within (standard setting: 300 ms). In this way you can influence how large the gap between two tops can be before they should be registered as two separate road users. NB! Be careful if changing this value. If too big, two cars with a small gap between them will be registered as one.
Presence detector parameters
Minimum occupation percentage Fraction of the defined mask that must be occupied by a road user or a temporary object in the scene. Use this value to filter out noise or small road users, for instance pedestrians and bicyclists.
Movement Detector
The movement detector checks if there is activity in a specific direction in a certain area of the video by means of the Farnebäck dense optical movement estimation(Farnebäck, 2003). In the movement detector points in two consecutive frames are identified and matched. Objects moving across the detector will result in vectors that are dependent on the direction and speed of the object. Higher speeds will result in larger vectors. The amount of vectors per direction (in terms of degrees) is summed up for those vectors that are higher than a predefined value of the speed of the object. Vectors below this value are omitted.
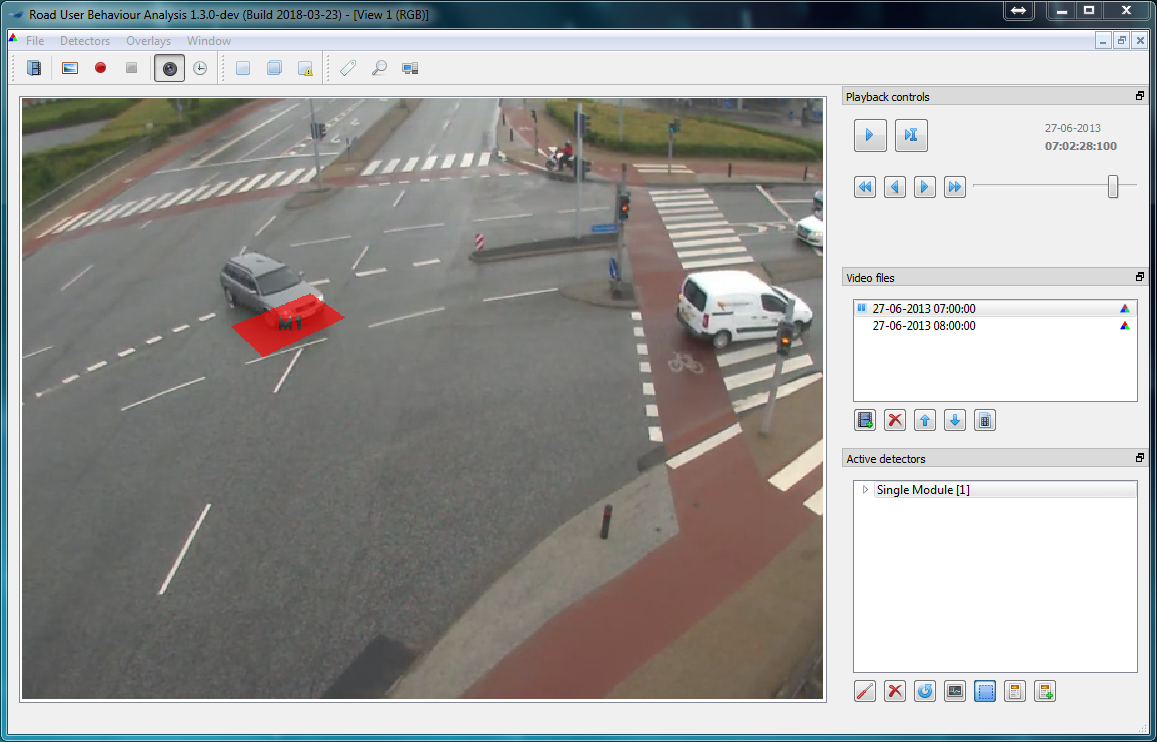
Figure | The movement detector (red). The movement detector detects activity (movement) in a specific direction through the detector
Movement detector histogram
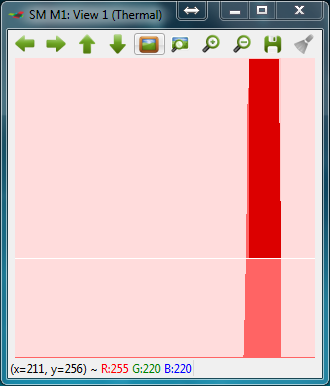
X-axis: time
Y-axis: activity through the detector (the higher red lines, the more activity was registered)
The red, vertical lines indicate that something has moved faster than the Minimum speed in the specified direction. The unit is not comparable to known speed units (e.g. m/s or km/h) but low values means that slow road users will be detected, high values that only fast objects will be detected. Choosing a narrow range of direction will result in limited activity and hence few/short red lines.
The white, horizontal line shows the Trigger threshold, i.e. how much activity is required to be identified as a road user (above the line) and what is considered as noise (below the line). To be detected as a road user, the red lines must go higher than the horizontal line and the width of the red lines above the threshold must be above the time interval which is defined in Delete events smaller than (standard setting: 200 ms). Only the dark red lines counts in the time that it should be above the threshold to be detected as a road user. The width of the dark red part should be approx. 0.5 cm when using the standard setting of 200 ms. If the activity for one road user results in two tops with a small gap in between (meaning that it will be registered twice), you can adjust the value for Collate events within (standard setting: 300 ms). In this way you can influence how large the gap between two tops can be before they should be registered as two separate road users. NB! Be careful if changing this value. If too big, two cars with a small gap between them will be registered as one.
Movement detector parameters
Trigger threshold Limit for when an activity will be registered. The parameter is used to sort out noise in the video. In the histograms the trigger threshold is shown as a horizontal line. To filter out noise, the red line must be above the horizontal line in four out of the last ten frames. This is visible from the histogram below; the red line is above the horisontal line in a short duration (three frames) before the detector is finally triggered and turns dark red.
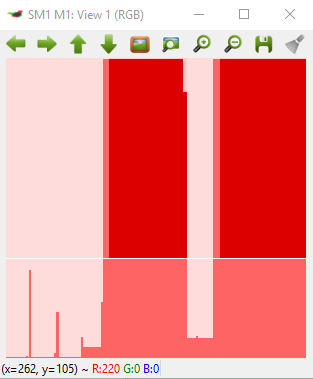
Minimum speed Measure for how fast an object must move to be registered in the movement detector. The higher value, the faster it has to move. The minimum speed is measured in pixel.
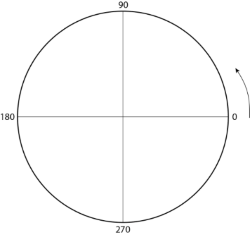
Flow range Defines in which direction the vectors must go if the activity should be registered as an event. The range can be chosen on a circle (0-360 degrees). The range is chosen by either inserting the range in the fields or by dragging in the dots on the circles.
Stationary Detector
The stationary detector detects if an object is idling or moves very slowly through a specific area of the video by means of a combination of the presence and movement detectors. To detect an object (a road user) the presence detector must be triggered, while the movement detector must not be triggered. This indicates that an object is present in the area but is moving very slowly or not moving at all.
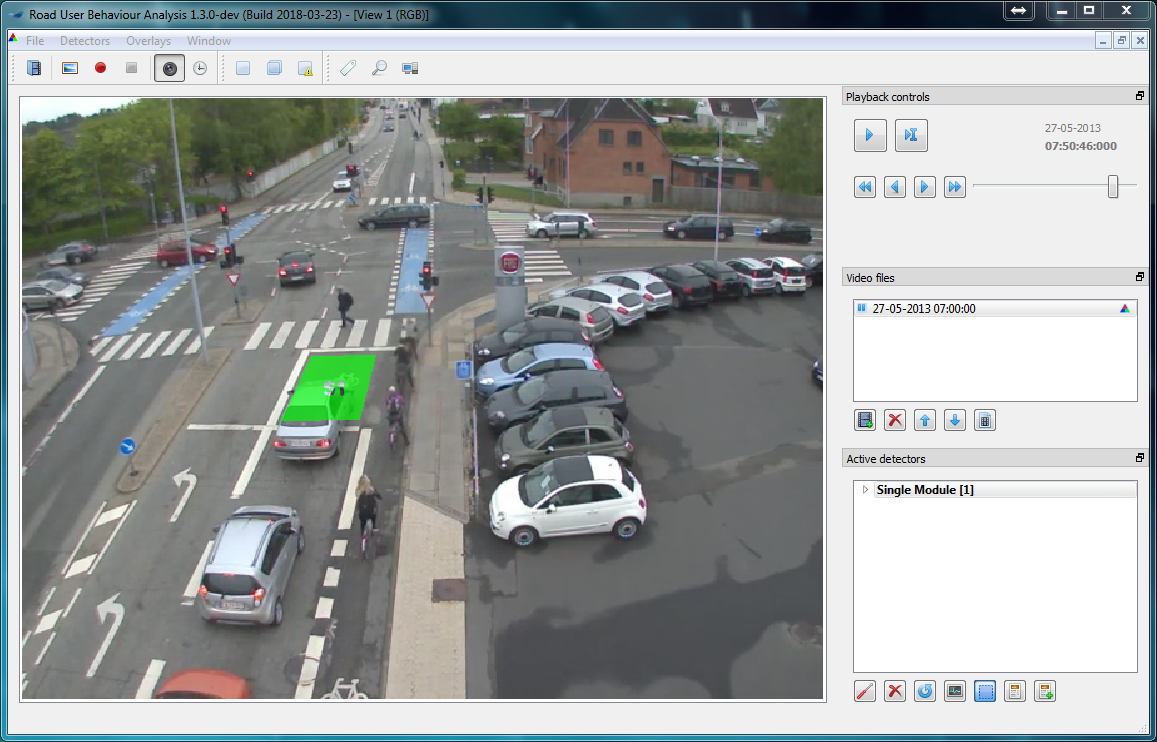
Figure | The stationary detector (green). The stationary detector detects if something is idling or moves slowly through the area covered by the detector
Stationary detector histogram
The histogram of the stationary detector is a bit different than the histograms of the other detectors, as the detector is a combination of the presence (blue) and movement (red) detectors.
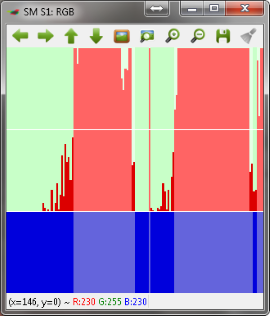
X-axis: time
Y-axis: activity through the detector (the higher lines, the more activity was registered)
The lower white, horizontal line shows if the size of the object that is present inside the detector is lower or higher than the Minimum occupation percentage.
The upper white, horizontal line shows the limit of how much the object can move and still be registered as standing still. The height of the red line shows the amount of activity in any direction with a speed higher than the Minimum speed. To be detected as a road user standing still, the blue lines must reach the lower white, horizontal line and the red lines must not exceed the upper white, horizontal line. If both of these criteria are met, the blue and red lines will turn into a brighter colour. If the width of bright coloured lines is above the time interval which is defined in Delete events smaller than (standard setting: 200 ms), a road user is detected. The width of the dark red part should be approx. 0.5 cm when using the standard setting of 200 ms. If there is a small gaps in the bright coloured lines, it will still be registered as one road user if the gap is smaller than the value for Collate events within (standard setting: 300 ms). NB! Be careful if changing this value.
Stationary detector parameters
Minimum occupation percentage See the description of the equivalent parameter for the presence detector.
Minimum speed See the description of the equivalent parameter for the movement detector.
Max vector count The maximum amount of vectors that is allowed to be above the defined minimum speed to result in an event. In other words; the maximum allowed amount of 'movement' in the mask. If the movement is larger than this, we do not consider the mask to be stationary.
Traffic Light Detector
The traffic light detector detects the different phases (red, yellow, red-yellow, and green) of a traffic light. The detector mask is to be defined in a small region around the traffic light and is used to perform image stabilisation. The image stabilisation is performed in order to make sure that the annotated traffic light positions follows the actual positions of the traffic light in case of small movements (oscillations) of the camera.
The traffic light positions should be annotated in the centre of the traffic light.
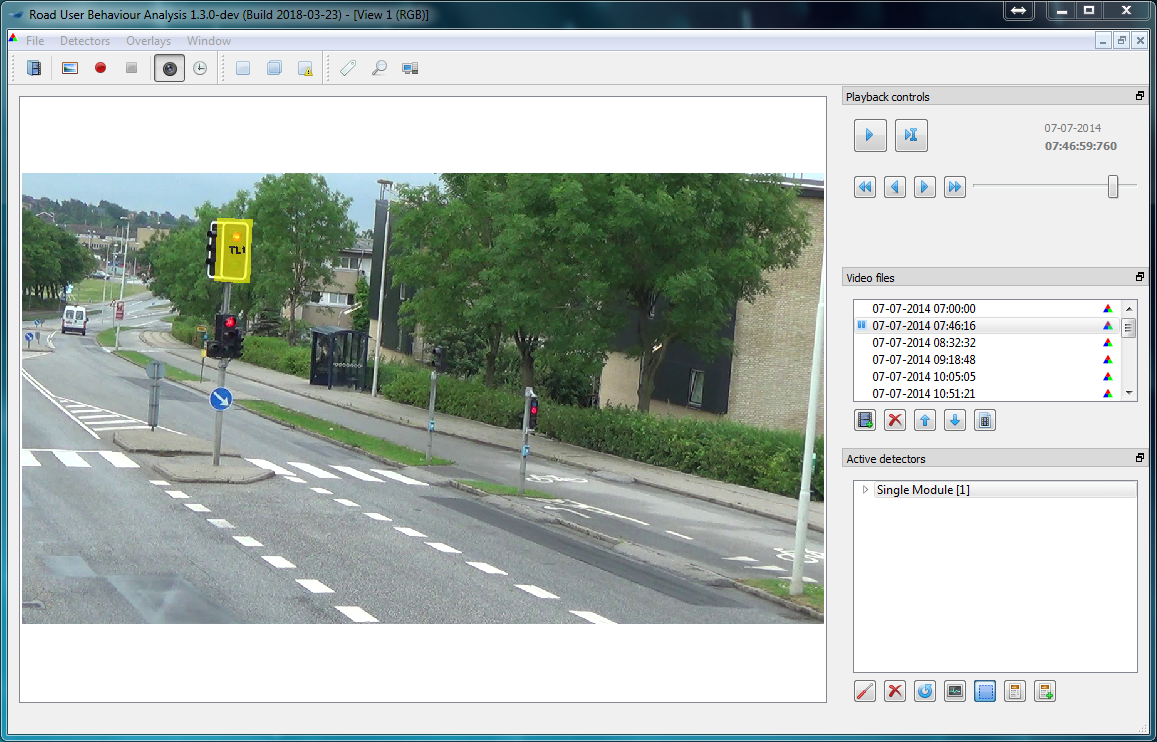
Figure | The traffic light detector (yellow). The traffic light detector detects thecolour of the traffic signal
Table | Overview of the possible states of the traffic light and the corresponding detections as defined by the colour trigger. The ambiguous state is activated if the detector is unsure of the state of the traffic light
| Colour trigger | |||
|---|---|---|---|
| Traffic light state | Red | Yellow | Green |
| Red | x | ||
| Red-yellow | x | x | |
| Yellow | x | ||
| Green | x | ||
| Ambiguous |
Traffic light detector histogram
The histogram of the traffic light detector visualises the detected state of the traffic light.
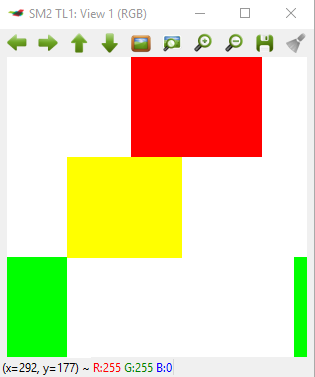
X-axis: time
Y-axis: detected state of the traffic light
The five states of the traffic light are displayed in different colours that may be seen from the annotated histogram below:

Detected states in order of appearance (left to right):
- Green
- Yellow
- Red-yellow
- Red
- Ambiguous (blank)
- Green
Detector Modules
The four detectors can be combined in detector modules. The modules manage logic between one or two detectors. Furthermore, the modules define when a detector takes on one of three states:
- Activated: When a detector is activated, movement in the field can be registered.
- Triggered: The detector has registered activity of the right type (e.g. the right direction) and in an extent that indicates that the movement comes from a road user (and not just noise in the image).
- Flagged (results in the detection of an event) When the detector has been triggered for a number of consecutive frames, an event is registered and saved in a log file.
RUBA consists of a single module (one detector), a double module (two detectors), and an exclusive module (two detectors).
Single
Consists of one detector type (presence/movement/stationary/traffic light). An event is saved in a log file when the criteria are met according to the specifications of the chosen detector.
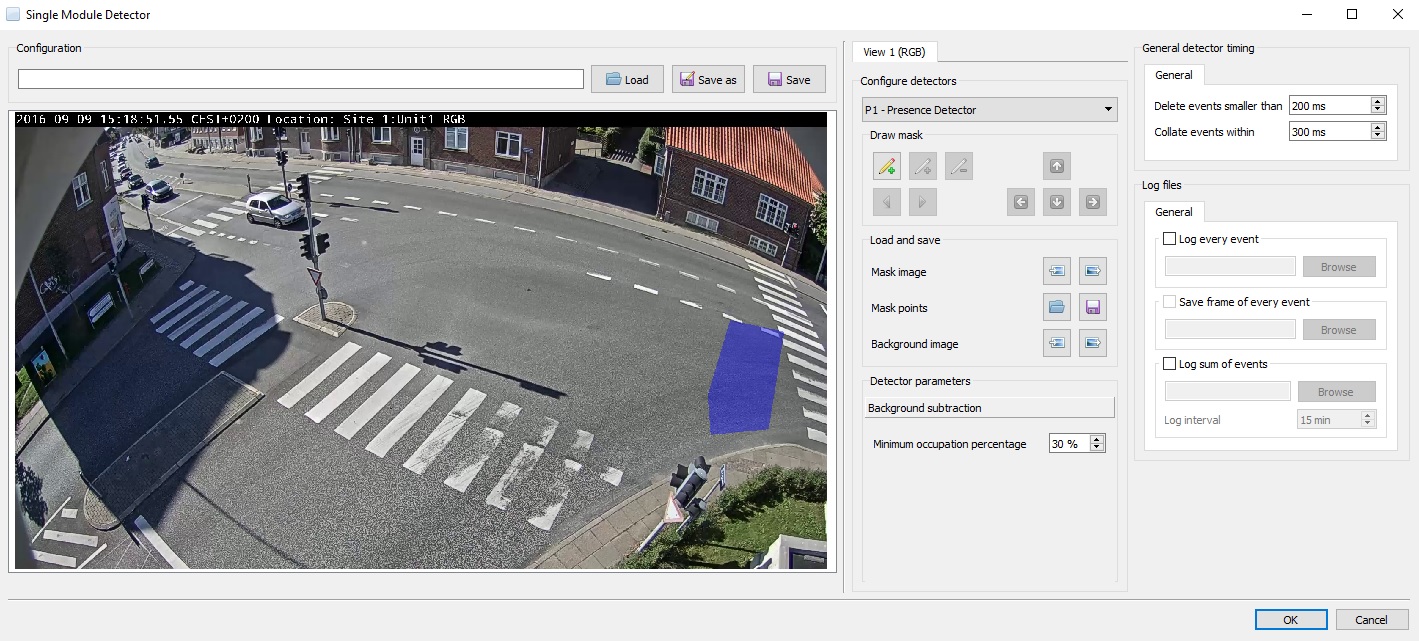
Figure | Example of a single module. The single module lets the user create one detector of one's own choice per module
Double
Consists of two optional detectors. An event is detected and saved in the log file when both detectors have been triggered within a specific time distance defined by the user.
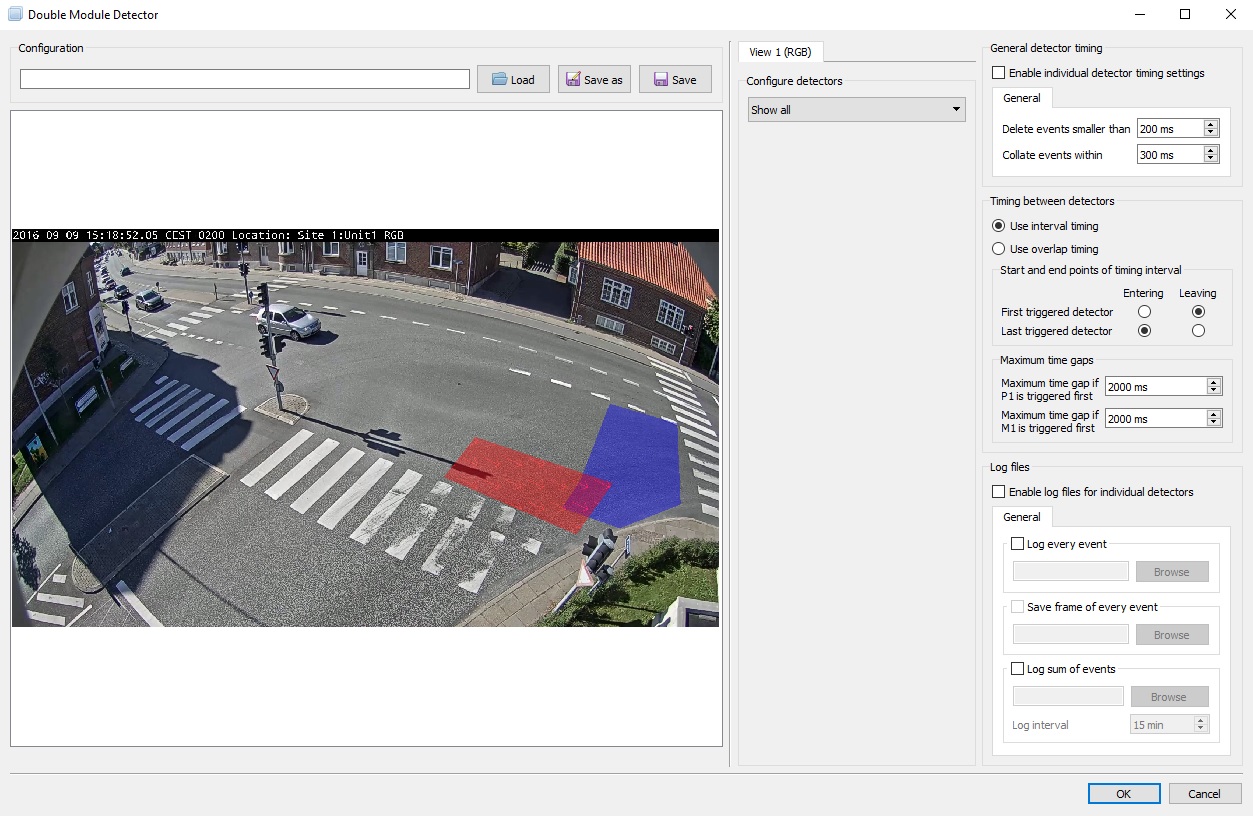
Figure | Example of a double module. The double module lets the user create two detectors of one's own choice per module
The timewise relation between the two individual detectors can be defined in two ways. ´Interval timing´ can be used to define the maximum time gap between the two detectors are triggered or stop being triggered. For instance, the time can be defined as the the interval from a vehicle enters one detector and another vehicle enters the other detector. ´Overlap timing´ is used when the two detectors should be activated simultaneously. It is possible to define a buffer so that events can be registered if the detectors are activated almost at the same time. Detailed information on the timing options is given in the log files and timing section.
Exclusive
Similar to the double module, the exclusive module consists of two optional detectors. An event is detected and saved in the log file only when the main detector is triggered and the excluding detector is not. If both detectors are triggered, an event is not created.

Figure | The Exclusive module is triggered when the main detector is triggered and the excluding detector is not.
Setting up the logger
To set up the logger, two aspects should be considered; timing settings and the type of output we get from RUBA. The common timing settings are related to each individual detector. Furthermore, there are additional timing settings for double modules to define when an event should be detected.
Common timing settings
The common timing settings are used to adjust when an event should be written to the log.
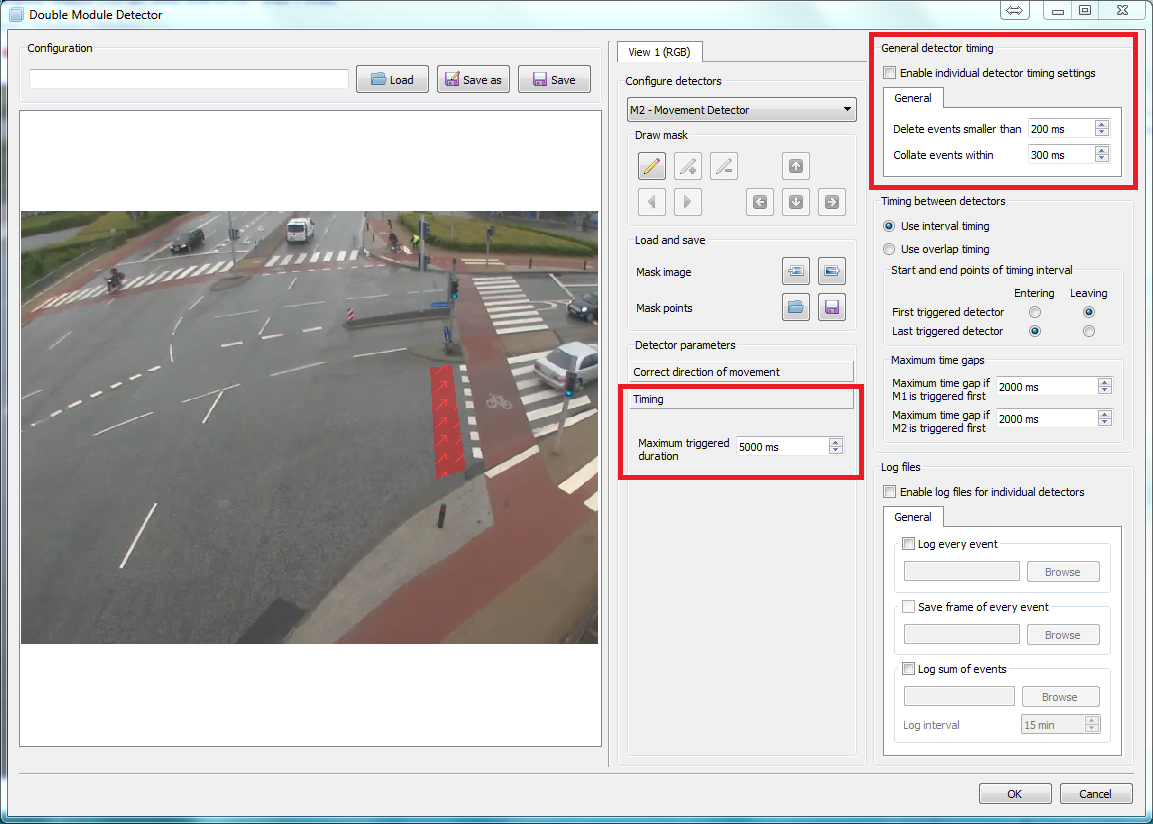
Figure | Common timing settings
Delete events smaller than
Deletes events that are only detected briefly, which often indicates noise in the image. Events with duration less than Delete events smaller than milliseconds will be omitted from the log.
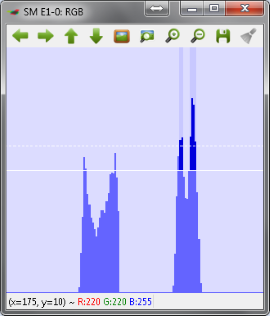
Figure | The two dark blue tops in the centre of the histogram will not be detected as an event if Delete events smaller than is greater than zero.
Collate events within
Combines separate events into one event if the time gap between them is less than XX milliseconds. This protects against multiple detections of the same object. If chosen too high, multiple road users driving close to each other will be registered as one road user.
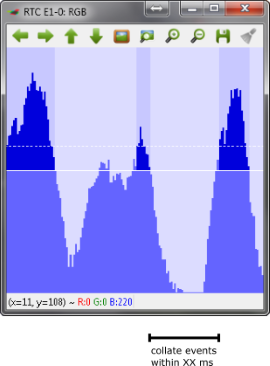
Figure | The dark blue tops in the centre and the right of the image might be grouped as one event if the Collate events within setting is greater than the time difference between the two detections.
Maximum triggered duration
Defines the maximum allowed duration (in milliseconds) of an event. If an event is longer than the specified maximum duration, it will be cut off after the max triggered duration has gone, and a new event will be created immediately thereafter.
Double module timing settings
Timing between the two individual detectors of a double module can be defined using either ´interval timing´ or ´overlap timing´.
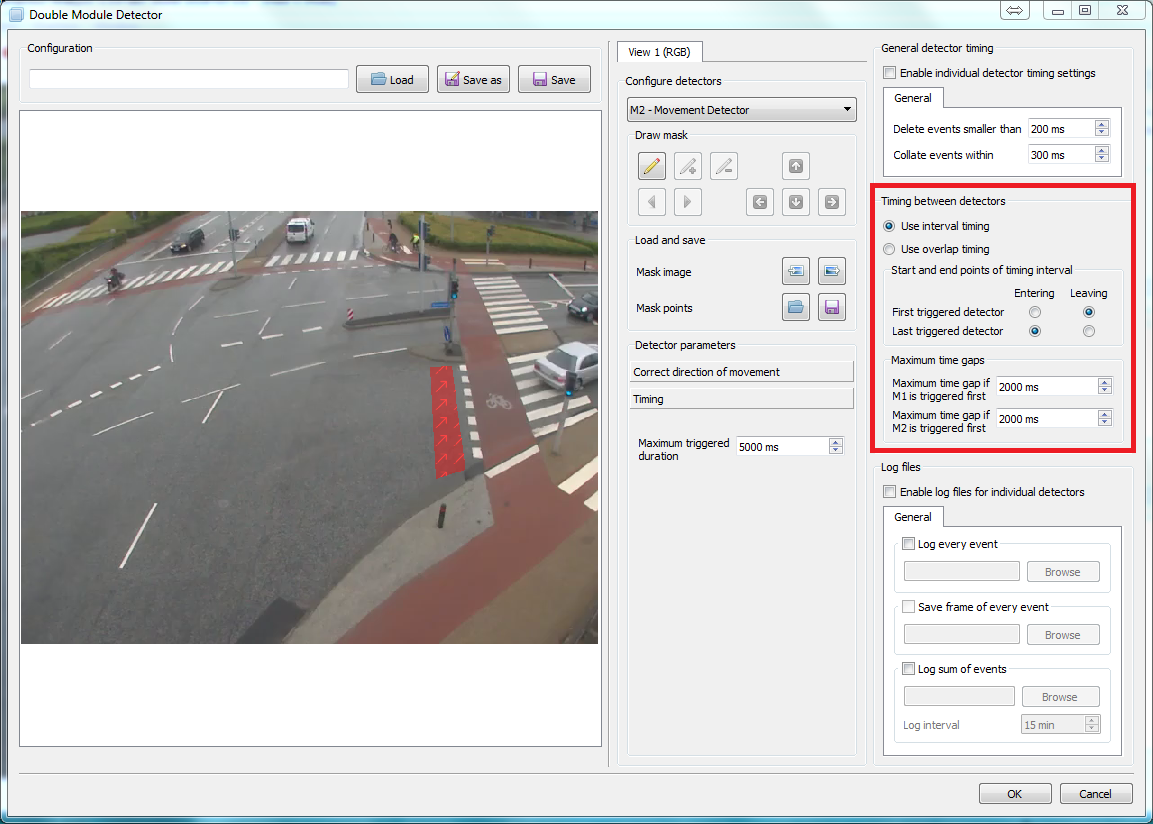
Figure | The Double Module offers two timing modes; interval timing and overlap timing.
Interval timing
The interval timing denotes the maximum accepted time gap (in milliseconds) from the detection of activity in one detector to the detection of activity in the other detector. The point for measuring the time gap can be either when the detector is activated (i.e. when the detector registers a that a road user enters the detector) or when the detector is left (i.e. when the road user has just left the detector).
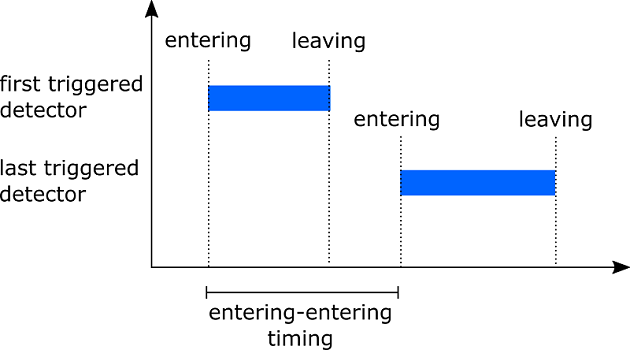
Figure | Illustration of Double Module interval timing. In this example, Entering is selected for both the First triggered detector and the Last triggered detector.
Overlap timing
The overlap timing detects an event if both detectors are activated simultaneously. A buffer (in milliseconds) can be used to also log events where the two detectors are activated at almost the same time.
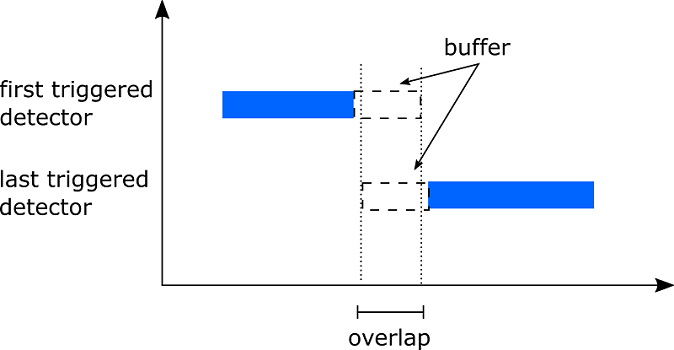
Figure | Illustration of the Double Module overlap timing.
Logs
Three types of output can be created:
- Log every event: creates a .csv file with one line for each detection.
- Save frame of every event: saves an image of what triggered the detector. For double modules, the saved image contains a screenshot of what triggered each detector, put side by side.
- Log sum of events: creates a .csv file with the total number of detections per log interval(in minutes).

Figure | The log files settings pane.
The content of the log file depends on the detector module. The table below gives an overview of the content of the log files:
Table | Contents in the log files. The files Analytics are created when marking Log every event in the settings/drawing window of the detector, while Counts will be created when marking Log sum of events. In the latter, the desired time interval can be specified (in minutes), e.g. 15 minutes.
Legend: Single Module = SM, Double Module = DM, Exclusive Module = XM
| Log every event | Log sum of events | Description | ||
|---|---|---|---|---|
| SM, XM | DM | All modules | ||
| File | x | x | x | File name of the video |
| Date | x | x | x | Date for video recording |
| Entering | x | x | Time stamp for arrival to the detector (i.e. there is activity in the detector) | |
| Leaving | x | x | Time stamp for when the detector has been left (i.e. is empty again) | |
| Timegap 1-2 | x | Time difference between an object has triggered detector 1 and an object has triggered detector 2 | ||
| Timegap DetectorX (1/2) | x | Time from one object arrives to detector X (trigger the detector) to the road user has left the detector | ||
| FirstTriggered | x | Which of the two detectors was triggered first? | ||
| TimeStart | x | Time for the beginning of the time interval | ||
| TimeEnd | x | Time for the end of the time interval | ||
| Object | x | Number of objects that have been detected within a specific time interval |
Log Every Event Examples

Figure | Every event log from a Single Module Detector. The Duration column lists the time difference in milliseconds between the Entering Detector 1 and Leaving Detector 1.

Figure | Every event log from a Double Module Detector. In the First Triggered column, we see that the Movement Detector 1 (M1) always is triggered first in this sample. The Frame column shows the file name of the corresponding snapshot image for each event. If this column is empty, the Save frame of every event checkbox has not been ticket in the log settings.
Log Sum of Events Example
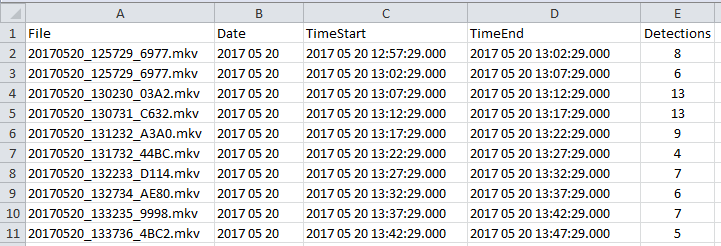
Figure | Sum of event log. All detector modules produce sum logs in this format.
Ground Truth Annotator
RUBA features a built-in option to perform manual event-based annotation based on timestamps. For example, we might want to annotate whenever a car turns right in an intersection or whenever a pedestrian passes a specific line in a zebra crossing. In the example below, we will set up the Ground Truth Annotator to perform annotation of different road users at an intersection.
Click on Ground Truth Annotator in the main RUBA menu.

Figure | Opening the Ground Truth Annotator
A new window opens. Click on Save log file as and specify the name of the file and where to save the log file. Put a check mark next to Auto-save to save the log automatically.
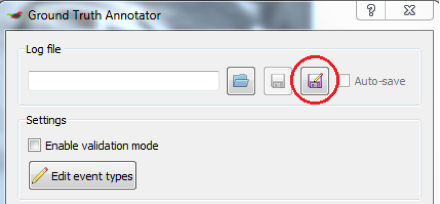
Figure | Save log files automatically in Ground Truth Annotator
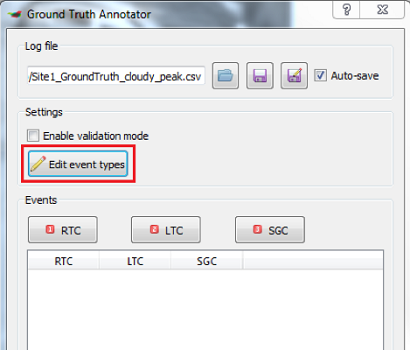
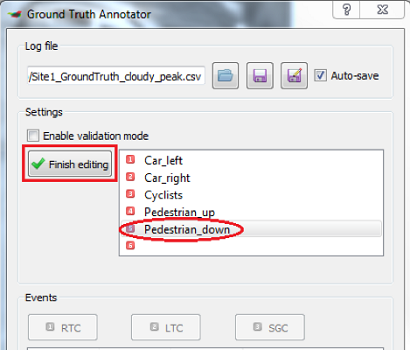
Click on Edit event types to specify the types of road users to register. Double click on the name to change, and press Finish editing to include the event types in the Event panel.
| |
|  |
|
Adjust the window and column sizes to get it to look more clear and place the window so that you can see the window and the main window of RUBA at the same time.
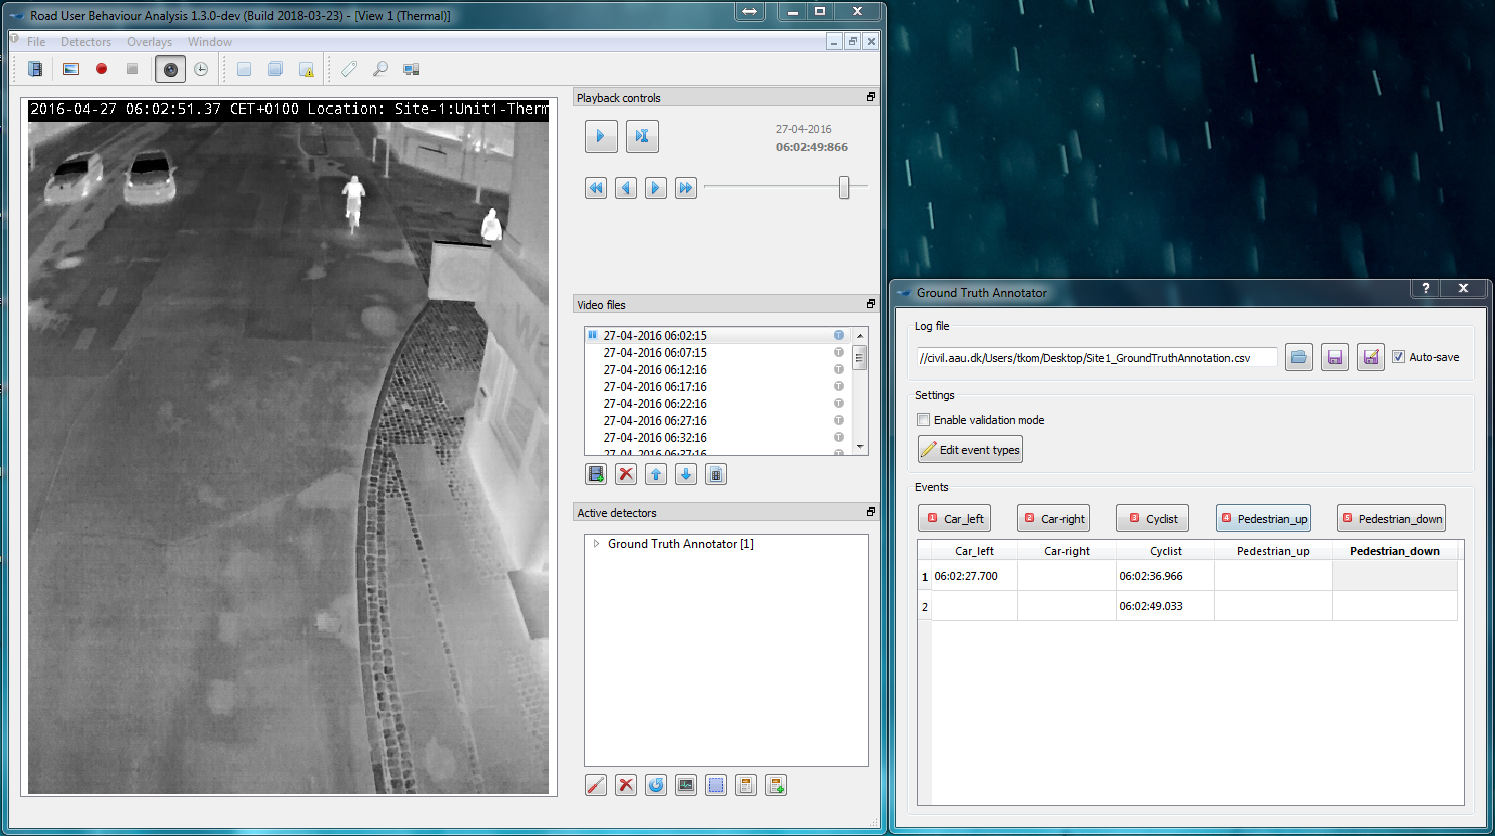
Figure | The Ground Truth Annotator should be placed beside the video window in RUBA to make the annotation process feasible.
Click in the Ground Truth Annotator (GTA) window and press space to start. Press space again to pause playback. Click on the corresponding button in the GTA window or press the number on the keyboard every time a road user of that particular type passes. Make sure that you register all road users at the same spot every time. All road users must be counted individually in the tool, so if there is a group of 2 pedestrians, press twice to register the road users.
Reviewing annotations
You may continue the annotation process or review the previous annotations by loading them into the Ground Truth Annotator. Either start the video from the beginning or double-click on an annotated time stamp to jump to this particular point in the video.
If you tick the Enable validation mode button during playback, the most recent annotated time stamp will be selected in the Events pane. If the Show masks button is also enabled in the main RUBA window, the annotated event information will be overlayed on the video when it takes place.
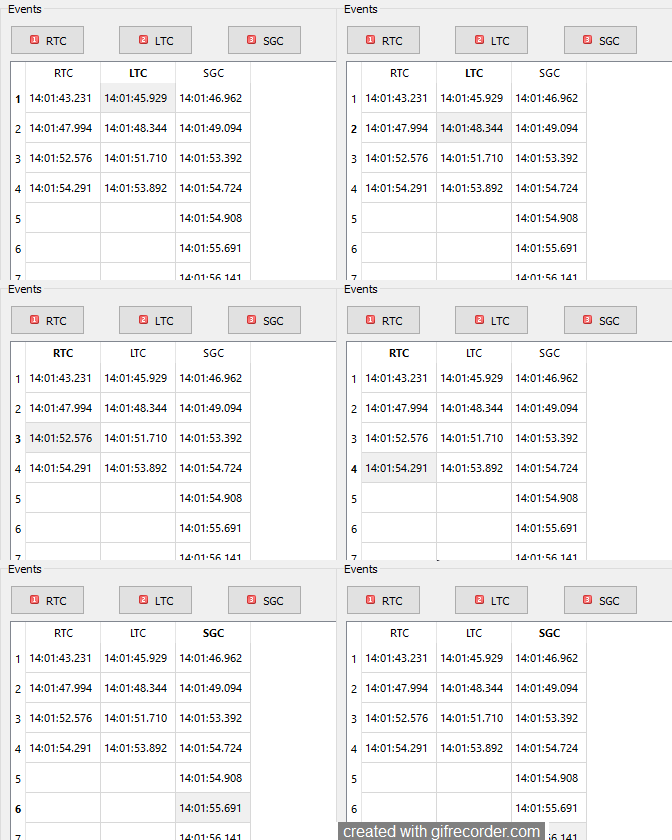
Figure | When validation mode is enabled in Ground Truth Annotator, the most recent annotation will be highlighted when the corresponding video is played.
Log File Reviewer
The Log File Reviewer is a tool to review and validate the log files as output by the detector modules of RUBA. Open the Log File Reviewer by pressing the button on the toolbar or press F11.

Figure | Opening the Log File Reviewer
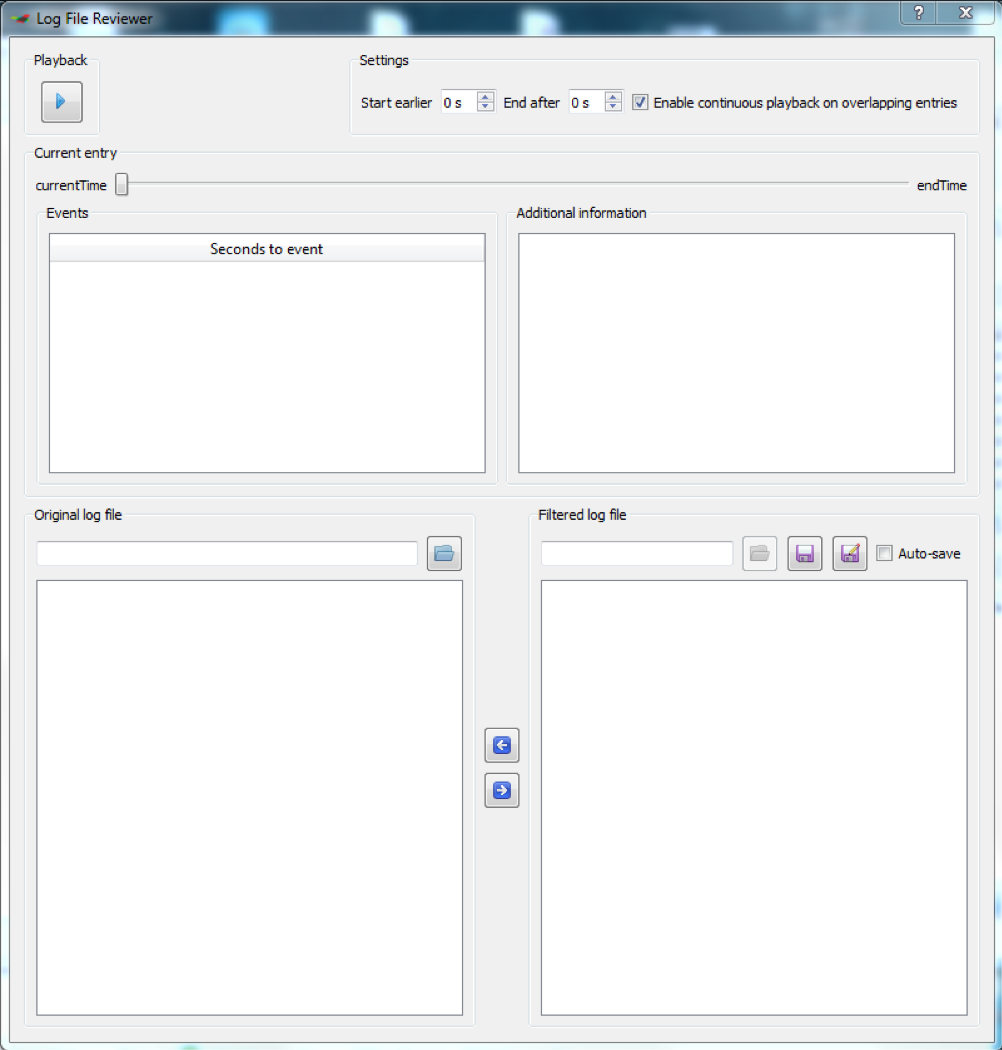
Figure | The Log File Reviewer when opened.
Open the log file that you want to inspect by clicking the folder icon in the Original log file window. Hereafter, click on the save button in the Filtered log file window and specify where to save the (validated) log file for further processing. Tick off the check box Auto-save.
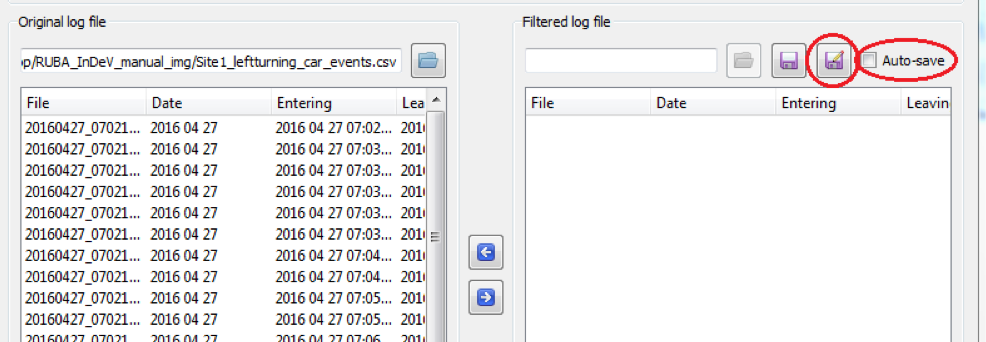
Figure | Setting the file path of the filtered log file
Define how many seconds should be played before and after the time stamp, e.g. 15 sec before the Entering and 10 sec after the Leaving timestamps in the log files.
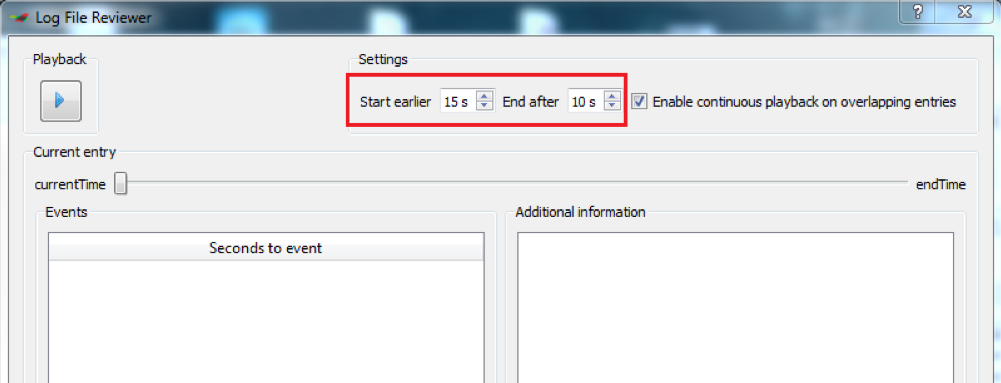
Figure | Setting the video playback properties
Adjust the size of the RUBA windows so that the normal window and the log file reviewer are both visible and placed next to each other.
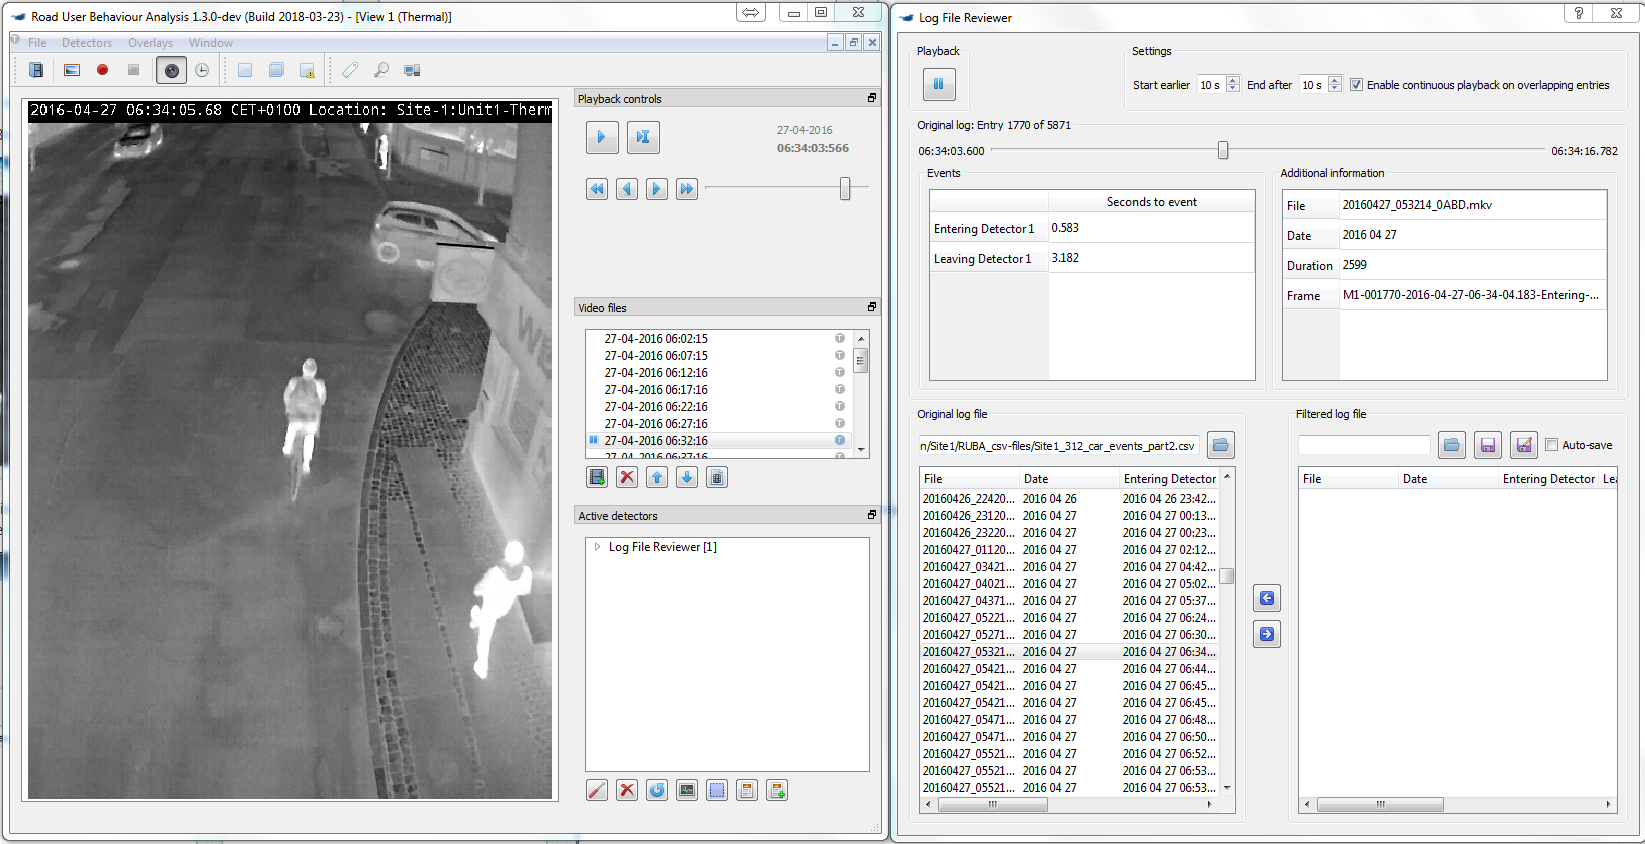
Double click on the first video in the list, then click the playback button. All events will be played one by one without break. Press the pause button to pause the playback (keyboard shortcut: space) and press again to start the playback (keyboard shortcut: space). You can double click on any of the events in the list to go to that event.
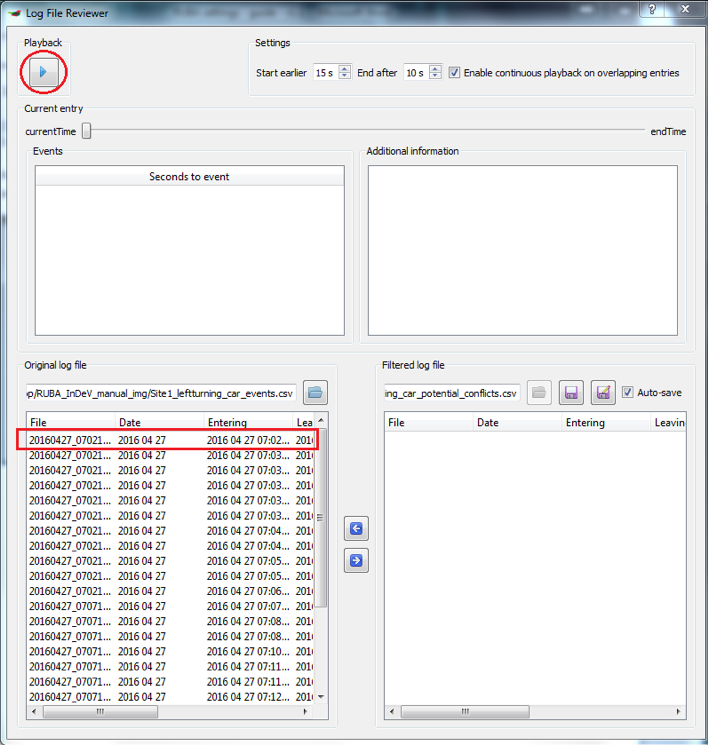
Figure | Starting the playback based on the events of the log file.
Adjust the speed on the sliding bar if it goes too fast/slow.
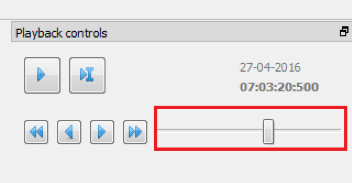
Figure | Adjusting the playback speed in the main RUBA window.
- Click on the blue arrow pointing right (keyboard shortcut: INS) to put an event from the original when there is a potential conflict. It is possible to select more events at once.
- Click on the blue arrow pointing left (keyboard shortcut: DEL) to remove an event from the filtered log file.
Please note that only the filtered log file is altered during this process. The original log file is read-only.
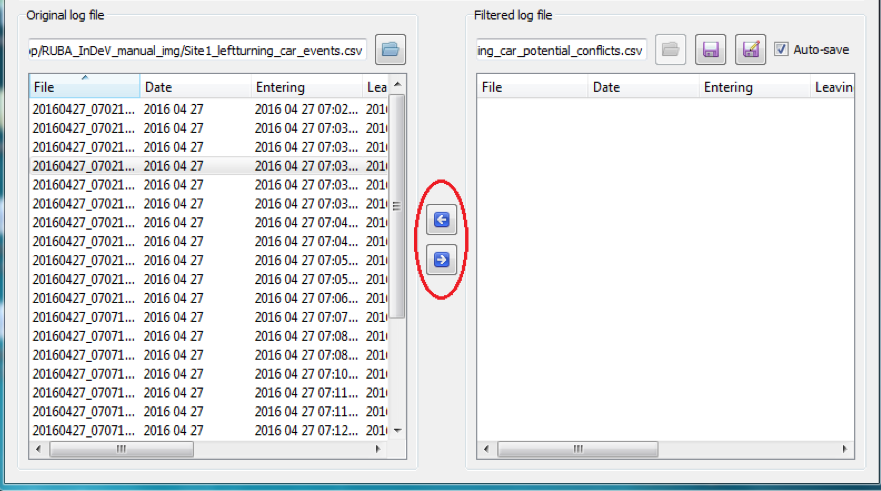
Figure | Inserting and deleting events into the filtered log file. ?
Updated
