Wiki
Clone wikiNuclear_Morphology / methods / Creating a new analysis
Running a new analysis
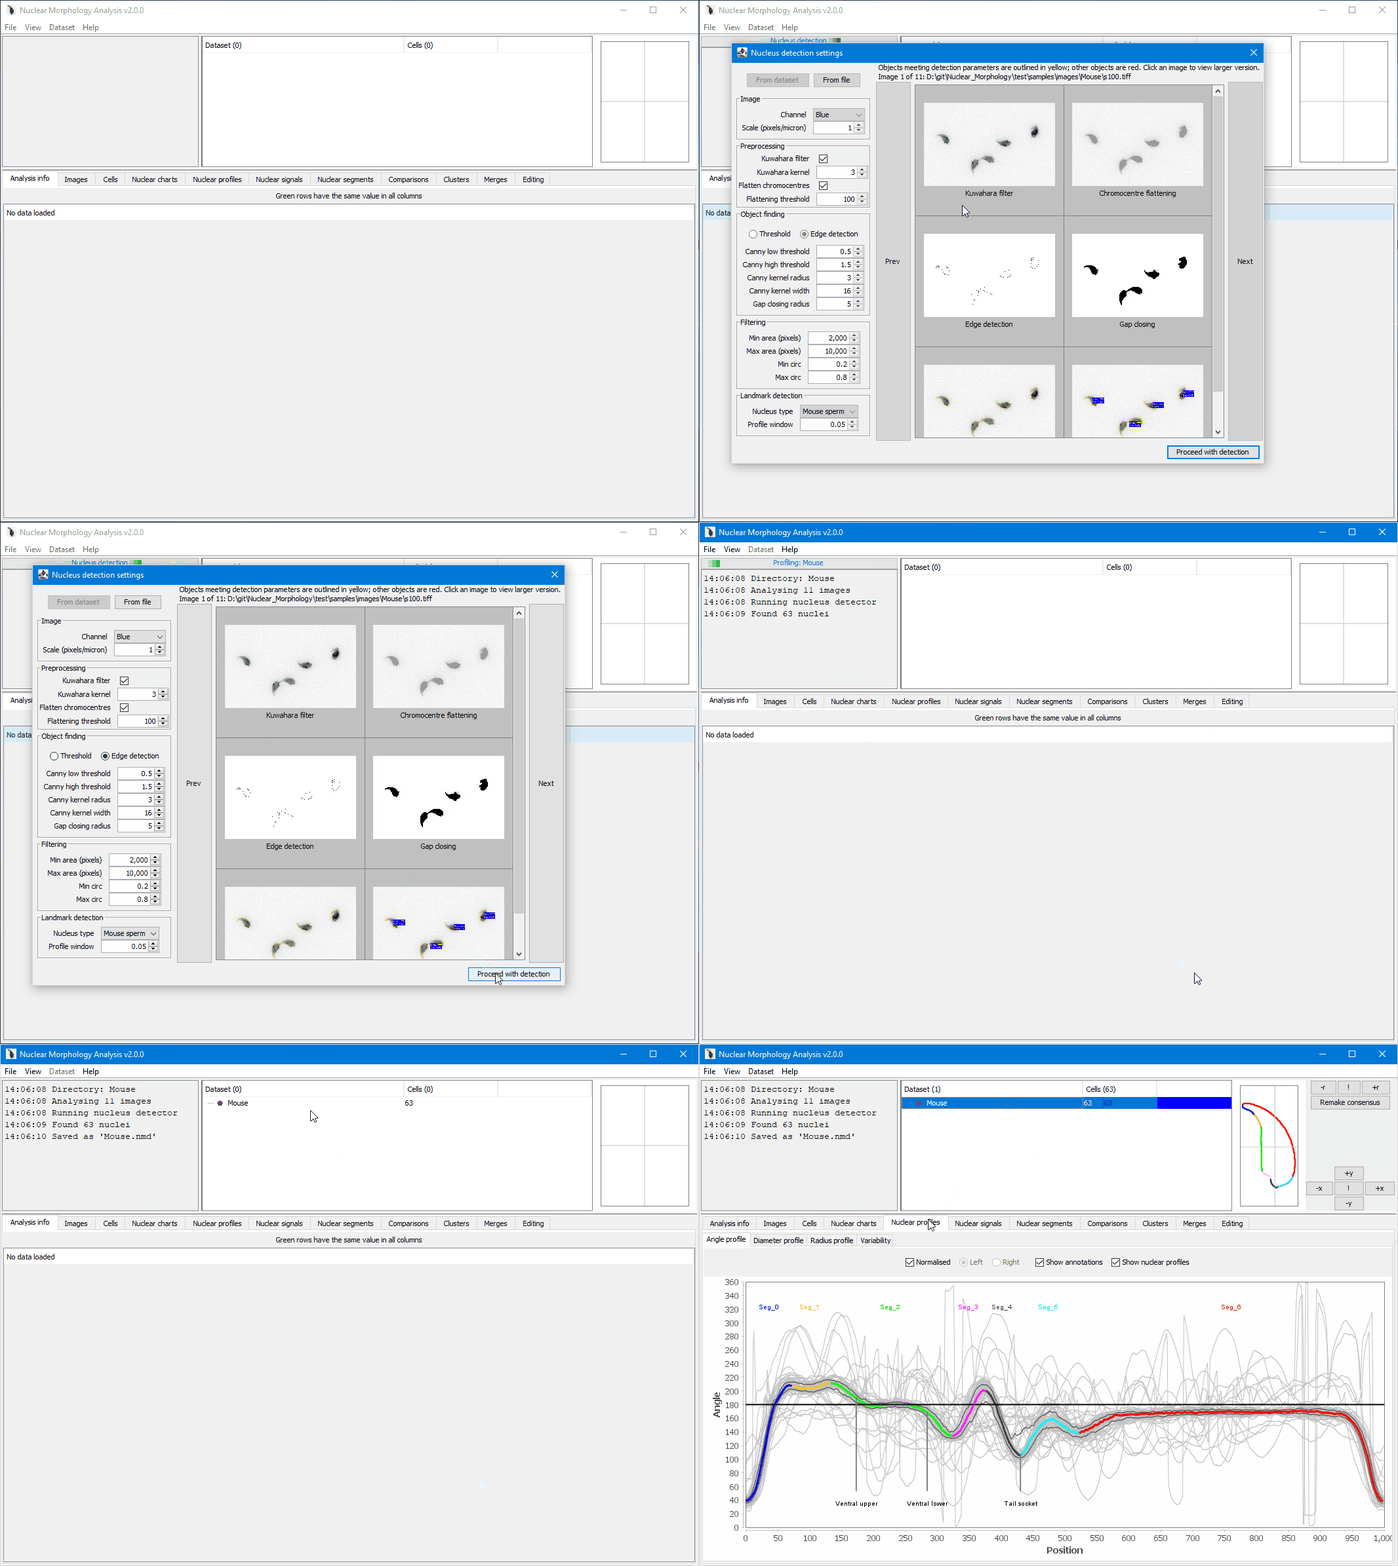
Very quick start
- Download and unzip the folder of test images
- Open the software
- Drag the folder of images onto the software
- Click 'Proceed with detection' to use the default settings (which work fine with these test images)

A more detailed start
There are several ways to start new morphology analysis:
-
By dragging a folder of images onto the software
-
By selecting 'File > New analysis > Use custom detection options' in the menu; you will be then asked to select a folder of images to be analysed.
-
By selecting 'File > New analysis > Use saved detection options' in the menu; you will be then asked to select a settings file, and a folder of images to be analysed.
The guide below uses a testing set of images, which you can download as a zipped folder.
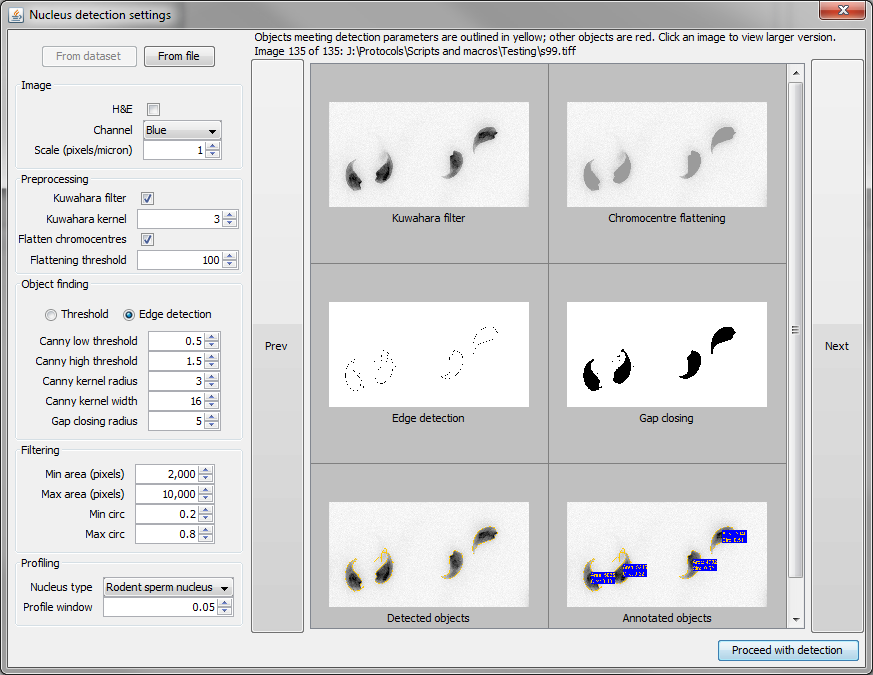
When starting an analysis using options (1) or (2), the following setup screen is shown. To help you choose appropriate settings, the images on the right show the pipeline for detecting objects in the first image of the folder selected. Each image enlarges when clicked. If you are happy with the result, select 'Proceed with analysis', otherwise adjust the settings. The images will be updated every time you change a setting. The 'Prev' and 'Next' buttons allow nucleus detection to be run on successive images in the folder(s).

The settings panel contains the following sections:
Copying settings
At the top of the window are 'From dataset' and 'From file' buttons. These allow nucleus detection settings to be copied from another source.
'From dataset' will only be available is an another dataset is open in the software when you are creating the new analysis. Clicking it will provide a list of open datasets, from which you can choose a dataset to copy detection settings from.
'From file' will open a file chooser so you can select a saved settings file.
Image
Set information about the images to be analysed.
| Setting | Controls |
|---|---|
| H&E | Is the image H&E stained, or fluorescence? |
| Channel | The RGB colour channel containing the nuclei (set to Greyscale if the image is black and white) |
| Scale | The number of pixels per micron. Allows the real size of images to be entered, so measurements can be presented in microns as well as in pixels. This can be set after an analysis is complete, so don't worry if you don't have this value to hand immediately. If you constantly use the same value (e.g. you only process data from one microscope) you can set is as the default in the configuration file. |
Preprocessing
Set options for removing background.
| Setting | Controls |
|---|---|
| Kuwahara filter | This smoothing filter is better at preserving edges than the standard Gaussian filter. If enabled, the kernel size must be an odd number |
| Kuwahara kernel | If enabled, the kernel size must be an odd number |
| Flatten chromocentres | Bright internal structures can cause the edge detector to pick the wrong feature as the nucleus outline. This option sets any pixels brighter than the threshold value to equal the threshold, thereby removing bright peaks. |
| Flattening threshold | The value to use for chromocentre flattening |
Object finding
| Setting | Controls |
|---|---|
| Threshold | Uses an absolute signal intensity cutoff to decide what is a nucleus and what is not. |
| Edge detection | Uses the Canny edge detection method to find edges in the image. |
| Canny low threshold | Suppress weak edge pixels due to noise lower than this value. The default value was empirically chosen to work on mouse sperm images. |
| Canny high threshold | Suppress weak edge pixels due to noise higher than this value. The default value was empirically chosen to work on mouse sperm images. |
| Canny kernel radius | The radius for Gaussian blurring. The radius of the Gaussian convolution kernel used to smooth the source image prior to gradient calculation. The default value is 16. |
| Canny kernel width | The number of pixels across which the Gaussian kernel is applied. The included implementation will reduce the radius if the contribution of pixel values is deemed negligable, so this is actually a maximum radius. Must be at least 2. |
| Gap closing radius | The radius of the circle used for morphological closing. |
| Watershed | If your nuclei are close together or partially overlapping, e.g. from cell culture, this will use watershed segmentation to separate individual cells. Note that this is primarily designed for round nuclei, and the effect on asymmetric nuclei may not be what you want! |
Filtering
Once potential nuclei have been detected by thresholding or edge detection, it must be decided whether they are really nuclei. These settings filter the objects on size and shape.
| Setting | Controls |
|---|---|
| Min and max area | constraints on the size of the detected nuclei. |
| Min and max circ | constraint on circularity. A value of 1 is a perfect circle; a value of zero is entirely non-circular. |
Landmark detection
| Setting | Controls |
|---|---|
| Nucleus type | A dropdown list to select the type of nucleus being analysed. The choice of nucleus type determines the rules that will be used to identify landmarks in the nucleus. The rulesets listed correspond tothe files in the rulesets folder. Custom rule definitions can be added by the user. |
| Profile window | The window size used to generate morphology profiles. Too low, and you won't detect any features of interest. Too high, and you get enough resolution. The profile window is set as a faction of the perimeter of each nucleus, from zero to one. The default value is 5% of the perimeter, 0.05. The effect of the window size can be seen in the angle window explorer via the Editing tab. The angle window can be altered after an analysis has been run. |
Start the analysis
When ready, click the 'Proceed with detection' button in the lower right to be begin finding nuclei. A progress bar in the upper left of the screen (above the log panel) shows the progress through the images in the selected folder. If no nuclei are found in any of the images, no datasets will be returned. If nuclei were detected, they will be analysed, and the new population will appear in the populations panel.
Updated