Wiki
Clone wikitutorial-edinburgh2016 / LSDMap / Analysing MD data with LSDMap
Analysing MD data with LSDMap
Why LSDMap
The LSDMap (Locally-Scaled Diffusion Maps) is a non-linear dimension reduction method. The non-linear description allows describing protein behavior using fewer dimensions. The approach and derivation from well-known equations are described in W. Zheng, M.A. Rohrdanz, M. Maggioni, C. Clementi. "Polymer reversal rate calculated via locally scaled diffusion map" (2011) Journal of Chemical Physics, 134 (14):144109 and Nadler, B, Lafon, S, Coifman, R. R, & Kevrekidis, I. G. (2013) Diffusion maps, spectral clustering and reaction coordinates of dynamical systems. Applied and Computational Harmonic Analysis 21, 113–127.
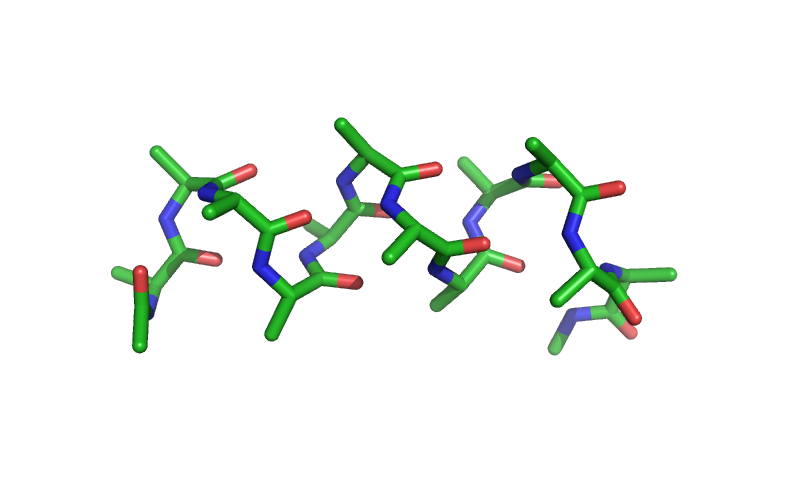
Due to time constraints for this tutorial, we will look at a small system, the peptide Alanine 12 (Fig.1). This peptide folds into an alpha-helix.

Fig 1. Structure of Alanine12 peptide
The data supplied to you contains the structures and the according weights of an equilibrated ensemble of structures. LSDMap requires equilibrates ensembles of structures. The structure file alanine12.gro describes the ensemble of structures. In this case, the 1000 structures are used. A larger number of structures give better results but lead to longer time required to calculate LSDMap. The weight file alanine12.w gives the weight of each structure in equilibrium. The weights in the weight file are in the same order as the structures in the structure file.
The data are also available here. In this tutorial, we are analysing the data from J. Preto, C. Clementi "Fast recovery of free energy landscapes via diffusion-map-directed molecular dynamics." (2014) Phys Chem Chem Phys 16(36): 19181-19191.
LSDMap Command
All of the data for this tutorial are in ~/LSDMap-data on the workflow machine.
LSDMap should be already installed. Detailed installation instructions are here. First, just check your installation:
lsdmap -h
The most important command line arguments and options are:
- -c specifies the structure file, in this case, alanine12.gro
- -w specifies the weight file, in this case, alanine12.w
- -f specifies the configuration file
In the configuration file config.ini the important options are:
- status specifies the type of epsilon. I can be either constant, proportional to the k-neighbor distance or the average of the k-neighbor distance (constant, kneighbor or kneighbor_mean respectively)
- epsilon: if constant epsilon is chosen
- k: if kneighbor or kneighbor_mean is chosen
Currently, the choice of epsilon or k is heuristic. The kneighbor_mean is usually a good option. Current improvements of LSDMap focus on the relationship between diffusion coefficients and epsilon. One of the current disadvantages of LSDMap is the unclear value of epsilon.
Run LSDMAP
Run the following command, the expected wait time is less than one minute:
lsdmap -f config.ini -c alanine12.gro -w alanine12.w
The results of LSDMap are stored in alanine12.eg and alanine12.ev. The .eg file stores the eigenvalues of the slowest collective motions and the .ev file stores the corresponding eigenvectors. Each column in the file is one eigenvector.
Understanding the results
1. Eigenvalues
The first eigenvalue in ala12.eg represents the equilibrium probability distribution of the protein and should have a value close to 1. All other eigenvalues represent the collective slow motions and should have eigenvalues below 1. The magnitude of eigenvalues drops off sharply with the increasing number of the eigenvalue. This drop off is called spectral gap. The collective motions above the spectral gap have smaller relevance for the protein dynamics and can be ignored with a small loss in accuracy. The number of eigenvalues below the spectral gap, excluding the first eigenvalue, is a rough estimate of the dimensionality of the protein. To plot the eigenvalues call:
python plot_eg.py
plot_eg.png. Do you see a spectral gap? What is the dimensionality of Alanine 12?
2. Eigenvectors
A first understanding of the eigenvectors can be gained by plotting the eigenvector values of all the structures. For better visualisation, a Free Energy landscape in two eigenvector-dimensions can be calculated. The Free Energy landscape can show different local Free Energy minima of the protein and the connectivity between them. To plot the n-th and m-th eigenvectors as a Free Energy landscape call:
python plot_ev.py n m
What can you tell about the connectivity between different collective slow motions? Are collective slow motions independent of each other?
3. Protein motion corresponding to Eigenvectors
One challenge of non-linear dimension reduction methods is the non-linearity of the final results. The eigenvectors are behaving differently on different points of conformational space. One way to understand what an eigenvector represents is the comparison of structures along the eigenvector. The following command picks 10 structures along a specified line in the plane spanned by two eigenvectors.
python extract_structures.py i a b j c d
View the protein motion along different directions. Do you recognize one eigenvector which represents to the folding/unfolding motion? What do the other eigenvectors represent?
Updated