Wiki
Clone wikimofem-joseph / Crack propagation in graphite beam
###Crack propagation in graphite beam###
Keywords: Crack Propagation, Fracture, High-Order Approximation, Automatic Mesh Refinement
Problem description
A graphite beam with a simple notch is examined in a three point bending test as indicated in Figure 1 below. We want to calculate the propagation of the crack from the notch through the graphite beam.
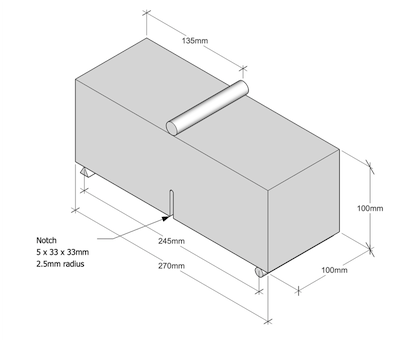
Figure 1. Graphite beam with notch in three-point bending
Files
The CUBIT journal file required to generate the model can be downloaded from here:
The files are also located under /mofem_install/mofem/benchmarks/three_point_bending_graphite_simple_notch_symmetric/ in the MoFEM source and build directories.
Geometry
Considering the figure above, the graphite beam is 0.27 m long, with a square cross-section of 0.1 m by 0.1 m. The notch measures 0.005 m by 0.033 m by 0.033 m with a 0.0025 m radius at the notch tip. There is 0.245 m between the supports and the loading pin is placed in the centre of the beam span.
Material properties
Young's modulus E = 109 N/m²
Poisson's ratio v = 0.2
Griffith energy g = 2e-6 N/m
For convenience, the values of E and g above have been scaled by e-8. This is to achieve a Young's modulus close to 100 N/m² which will simplify the computational performance.
Loads
The reference load, which is scaled, at the top of the beam is equal to 1.
Finite Element Model
The finite element model consists of a relatively coarse uniform mesh of 4-node tetrahedral elements as shown in Figure 2. We will use automatically different orders of approximation and levels of mesh refinement to improve the solution. In addition to the load shown above, we apply displacement constraints at two edges of the beam to prevent rigid body motions (see T3_horiz.jou).
The crack is defined geometrically in CUBIT by a single surface. It is worthwhile to note that the visible cylindrical cutout around the crack is only used to construct the crack geometry and optionally give better mesh control around the crack. The crack tips and crack surface are specified by custom sidesets.

Figure 2. Geometry (left) and mesh (right)
Analysis procedure
The analysis is run in two stages. The first stage uses a script to calculate the Griffith forces for 1st (linear) to 3rd (cubic) order 4-node elements. For each order, analyses with 1 and 2 levels of automatic refinement are run. All analyses were run on the ARCHIE_WeSt high performance computer using 12 processors with the FGMRES (Flexible Generalized Minimal Residual Method) Krylov solver for systems of linear equations and the LU preconditioner. The first script can be executed using:
$ ./convergence_study.sh -f T3_horiz.cub -l -1 -g 2e-6 -o 1,2,3,4 -r 1,2 -p $NPROC
If desired, the Mode I stress intensity factor ( ) can be calculated directly from the output Griffith forces, see the Analysis procedure section of the plate with horizontal crack benchmark.
The second stage uses a script to calculate, over a prescribed number of steps, the propagation of the crack for a specified approximation order and level of mesh refinement, using the resultant Griffith forces from the first stage. All analyses were run on the ARCHIE_WeSt high performance computer using 12 processors with the FGMRES (Flexible Generalized Minimal Residual Method) Krylov solver for systems of linear equations and the LU preconditioner. To calculate the propagation of the crack for the 2nd (quadratic) order with 2 levels of automatic mesh refinement, for example, the script can be executed using:
$ ./arc_length.sh -f $DIRNAME/out_spatial_2_2.h5m -a 1e-4 -n 100 -g 2e-6 -p $NPROC
$ ./face_split_arc_length.sh -f $DIRNAME/out_spatial_2_2.h5m -a 1e-4 -n 100 -g 2e-6 -p $NPROC
Results
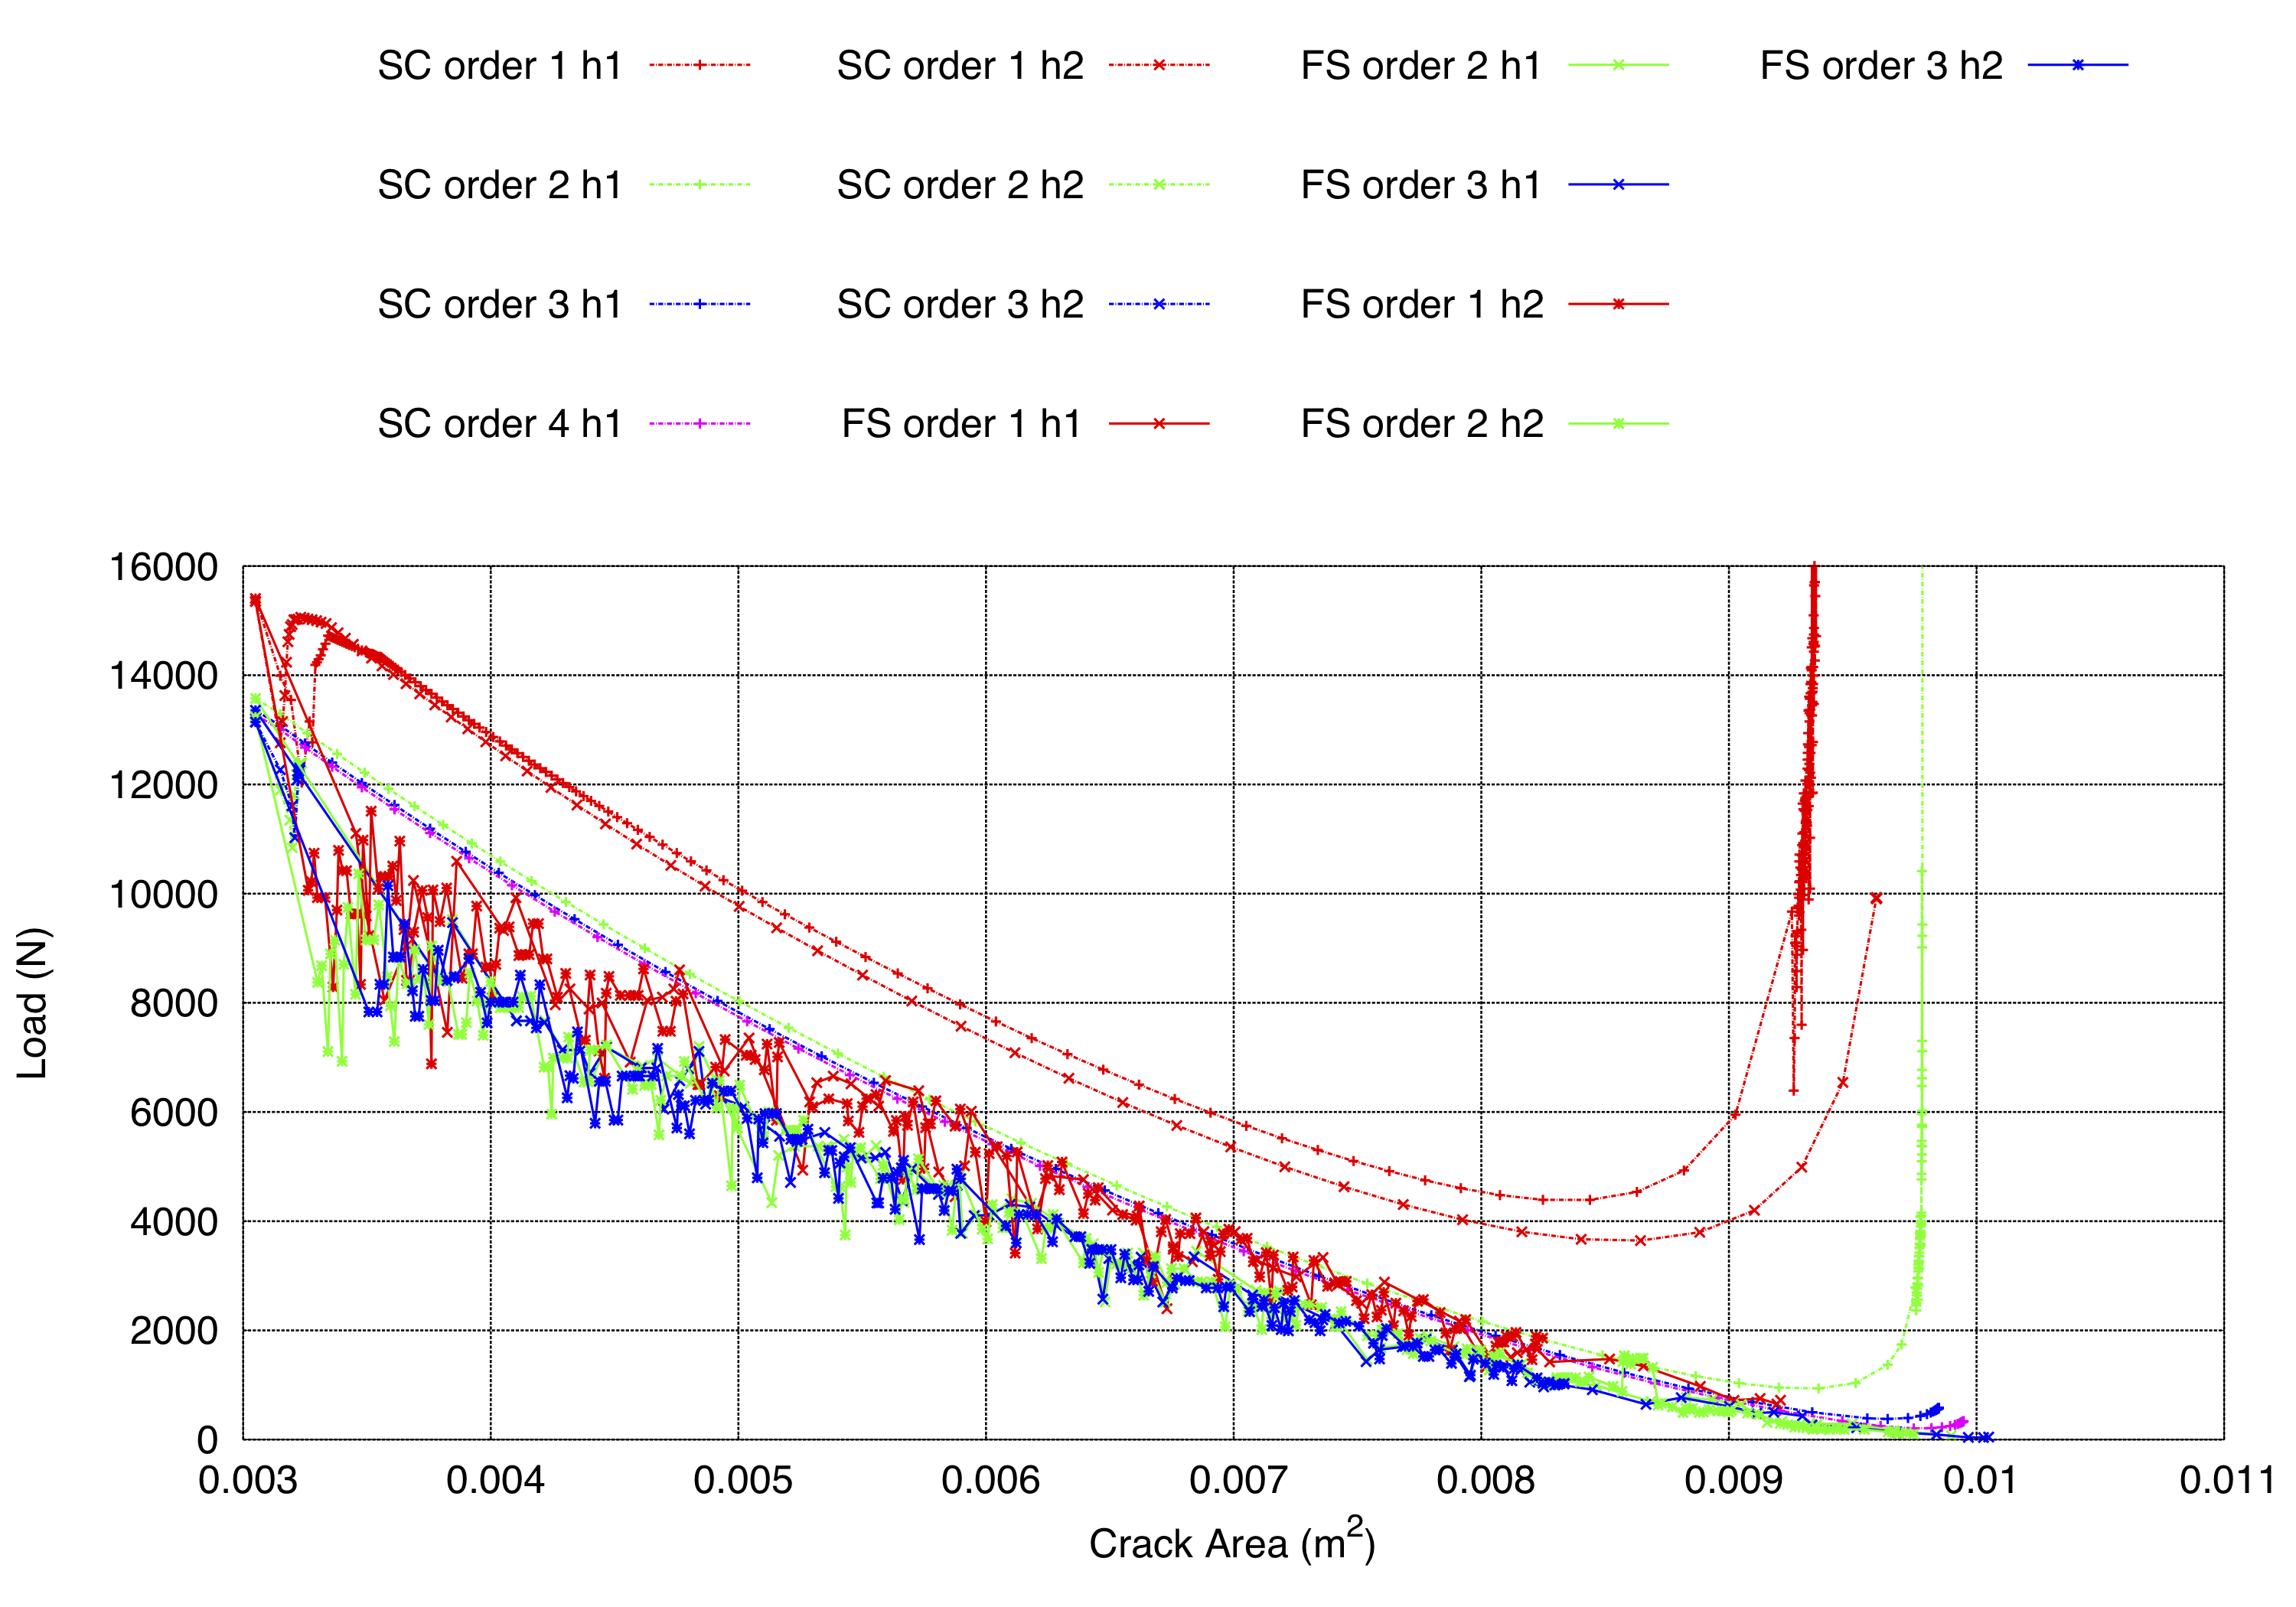
Figure 3 shows the deformed shape of the graphite beam for the 2nd order solution with one level of mesh refinement. The results from all analyses are illustrated in Figures 4 to 7. These show the crack mouth opening against load, and crack area against load for each analysis.
Figure 3. Deformed shape and displacement contours for 2nd order approximation with one level of automatic mesh refinement using standard crack propagation analysis (left) and crack propagation with face splitting analysis (right)
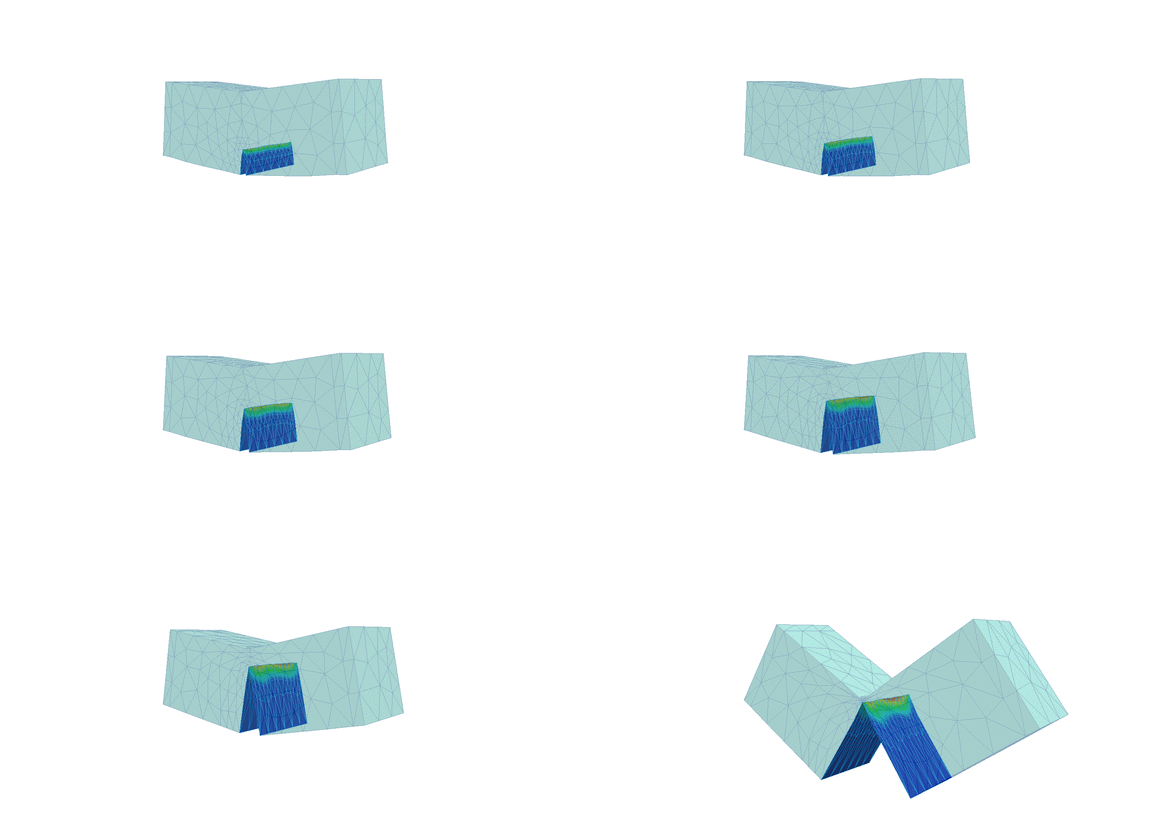
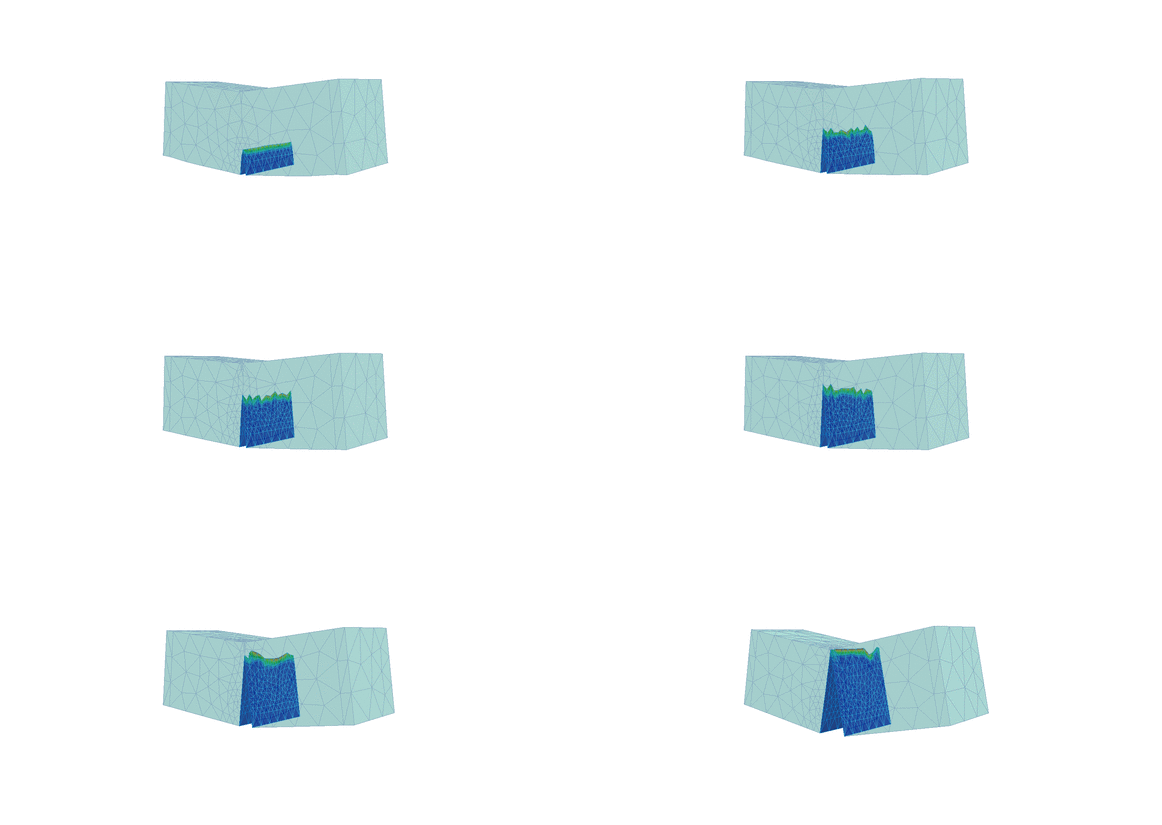
Notice the difference in crack propagation, the heavily distorted elements (left) and the refinement of the mesh (right) as the crack propagates through the beam. The script file required to extract the desired data (from log files) and plot the graphs can be downloaded from here:
The files are also located under /benchmarks/three_point_bending_graphite_simple_notch_symmetric/ in the MoFEM source and build directories. The graphs can be plotted using:
$ ./plot_graphs.sh -o 1,2,3,4 -r 1,2 -ent 1,785 -dim 0,1,2 -s 1e8*0.36*0.0005
where -s is a scaling factor which is the product of the applied load (see CUBIT journal file), the area over which the load is applied and the inverse of the scaling factor applied to E and g. This scaling is highly important to ensure correct results. Log files must be placed into a directory named log_files and log files must follow the naming convention log_ORDER_REF-LEVEL, with the plot file located one level above log_files. For more information on plotting, see Plotting information.
Figure 4. Crack mouth opening versus load for smooth crack propagation (SC) and crack propagation with face splitting (FS); note points have been removed for steps that did not converge
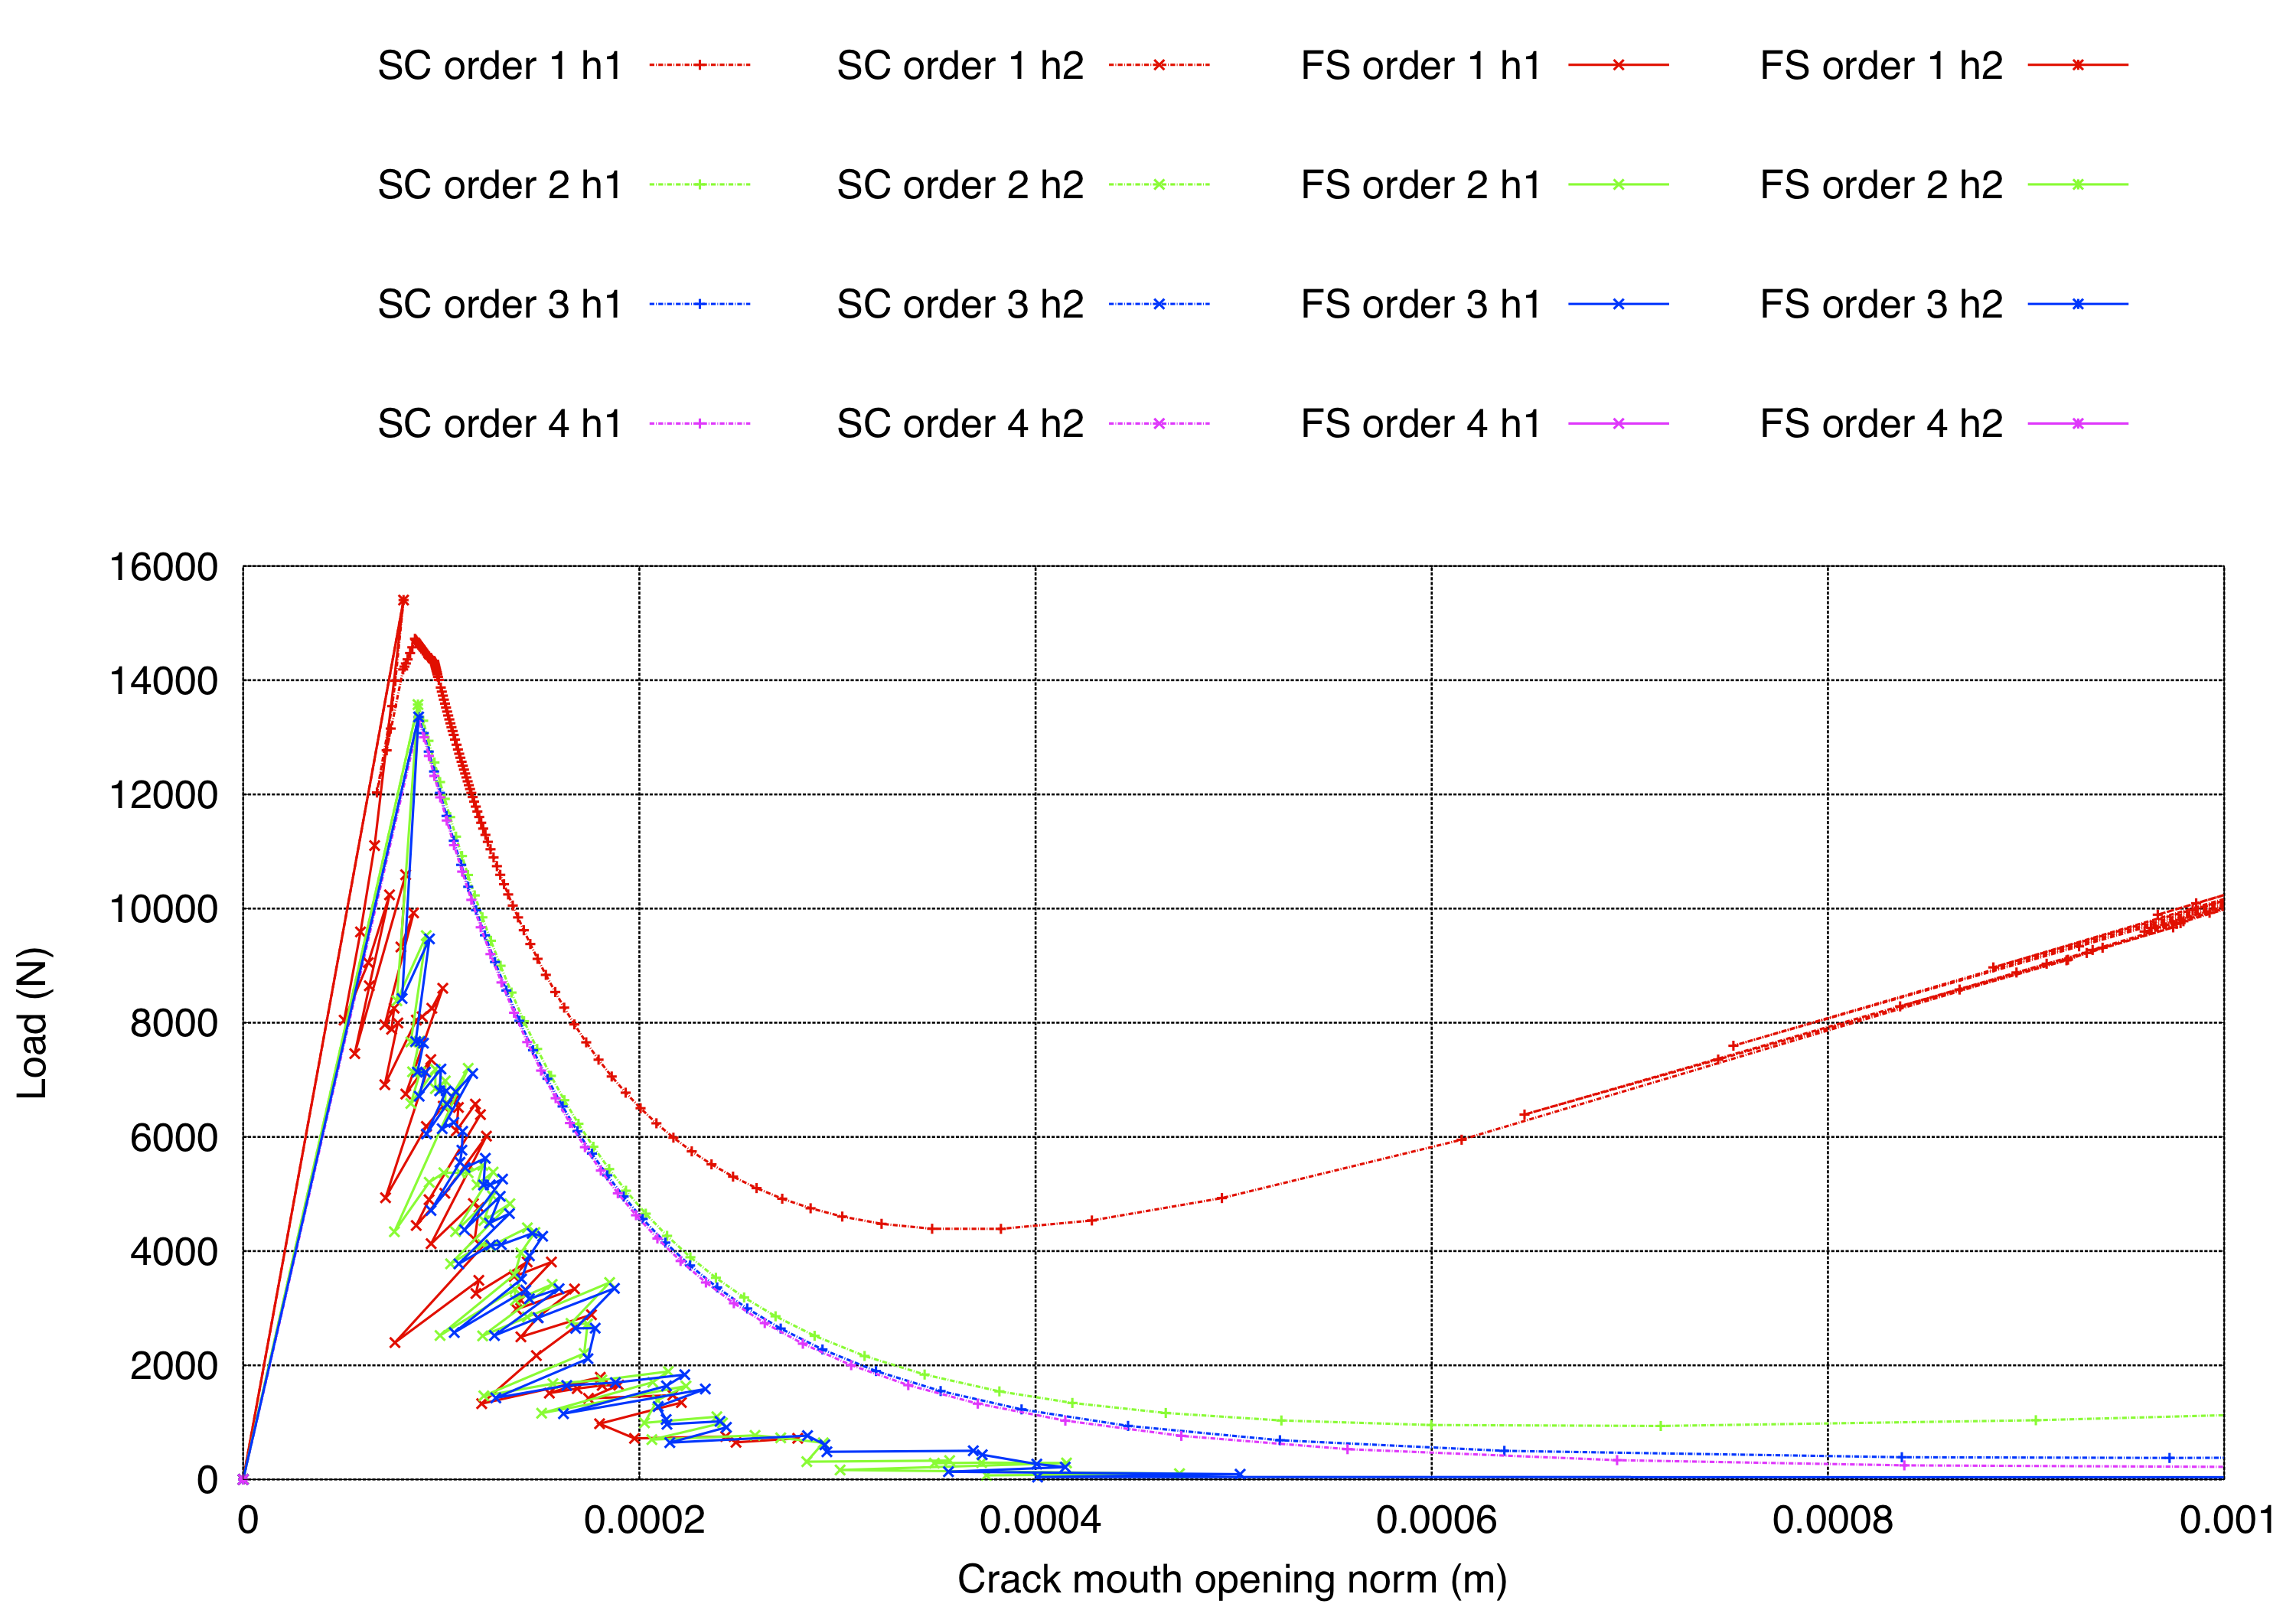
Figure 5. Crack area versus load for smooth crack propagation (SC) and crack propagation with face splitting (FS); note points have been removed for steps that did not converge
Discussion
- Linear elements are not recommended due to the occurance of shear locking.
- The crack propagation with face splitting (FS) is a lower bound solution and under estimates the strength of the beam.
- The solutions improve as both the level of approximation and the level of automatic mesh refinement increase.
- Towards the end of the smooth crack propagation analysis (SC), the elements become heavily distorted leading to the non-physical behaviour observed whereby the crack area stays constant for increasing load factor.
Acknowledgements
Results were obtained using the EPSRC funded ARCHIE-WeSt High Performance Computer (www.archie-west.ac.uk). EPSRC grant no. EP/K000586/1
References
- Three‐dimensional brittle fracture: configurational‐force‐driven crack propagation, Ł Kaczmarczyk, MM Nezhad, C Pearce, International Journal for Numerical Methods in Engineering 97 (7) 531-550
- Created by Ross Mackenzie
- any difficulties or suggestions email cmatgu@googlegroups.com
Updated