Wiki
Clone wikiplanchart2d / Documentation
![]()
This documentation is fading out. Pls find the latest documentation in our new Mirrorlake Support Confluence
Table of content:
Introduction
PlanChart2D is able to create bar and line charts with the purpose to show past and future progress of your work.
Content of one chart is based on the amount of issues defined by one Jira® filter. Using this filter the date fields inside an issue can be used to bild up different charts. Basically the gadget counts all issues of each date and visualize the result as normal count, burn-up or burn-down chart.
Two different progress types can be shown: planned progress (e.g. based on due date information) and real progress (e.g. based on resolved date information). The real progress chart always ends at todays date. The planned progress shows all tickets in past and future.
How to install the plugin
Pls visit the plugins marketplace page and find an installation instruction here.
How to setup an initial chart
To create a chart the following steps are required:
- Create a new or open an existing Jira® dashboard
- Click on "add gadget", select planchart2d gadget from the list
- In the plugin configuration screen select a filter and click "save"
Configuration Options
The following picture shows the configuration options of the plugin. Succeeding chapters explain the options in detail.
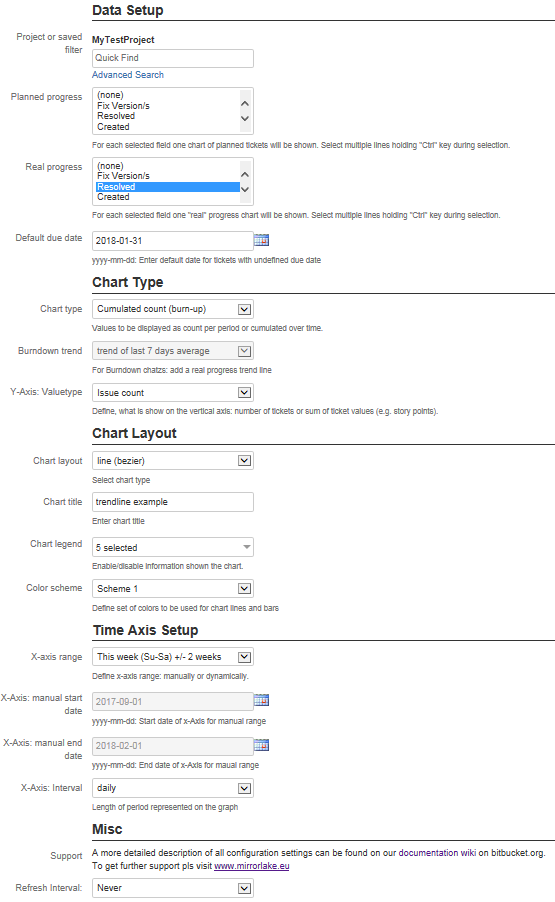
Data Setup
Project or Saved Filter
The fields defines the source of tickets to be taken for the chart planned and real progress data. You can select any predefined filter availabel in Jira® or just select a specific project.
Planned Progress
This drop-down list contains all Jira® date, datetime and version fields. You can select the date field to be used as a "planned" date. Based on this the issues will be used for "planned" progress in your chart. Normally this makes especially sense when taking "due date" fields for your planned data.
If you select a version field, the version "release" date will be taken for planned data as configured in the Jira® project/version setup.
Multiple fields can be selected by holding "shift" key and selecting several fields. For each field on own line/barchart will be created.
Real Progress
This drop-down list contains all date, datetime and version fields. You can select the date field to be used as a "real" progress date. Based on this the issues will be used for "real" progress in your chart. Normally this would make sense espacialle for fields that contain a "resolved" date.
If you select a version field, the version "release" date will be taken for planned data as configured in the Jira® project/version setup.
Multiple fields can be selected by holding "shift" key and selecting several fields. For each field on own line/barchart will be created.
Default Due Date
The default due date is used for all planned dates which are not set in an issue. This ensures the visibility of all tickets which are collected by the "planned filter".
The idea of the default due date ist the following: a user want to see a planning curve of all tickets based on the defined due date. But some tickets do not have this date yet. In order to show them at least at some point, he can decide to define a date where these tickets will be planned by the chart plugin, e.g. on the last release date.
The default date is only used for planned tickets. A real progress issue is only considered based on a set date in the ticket.
*Example:
The following chart is configured with a filter, showing 8 tickets, planned date is set to "due date". Red bars show: three tickets have a defined due date. Remaining 5 issues are set to 11/11/2017 (default due date).
*
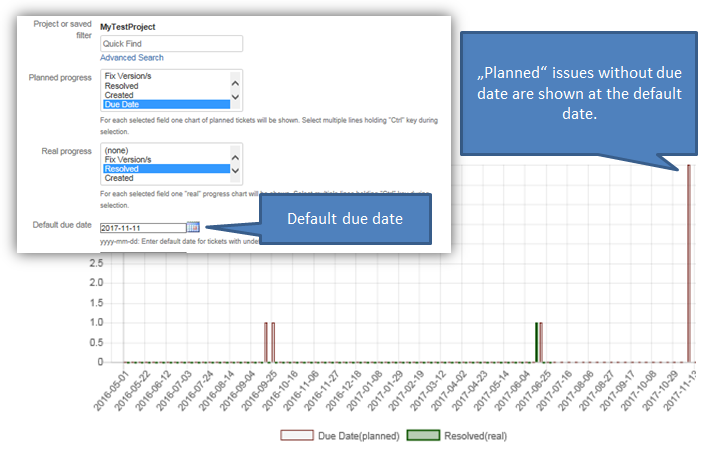
Chart Type
Chart Type
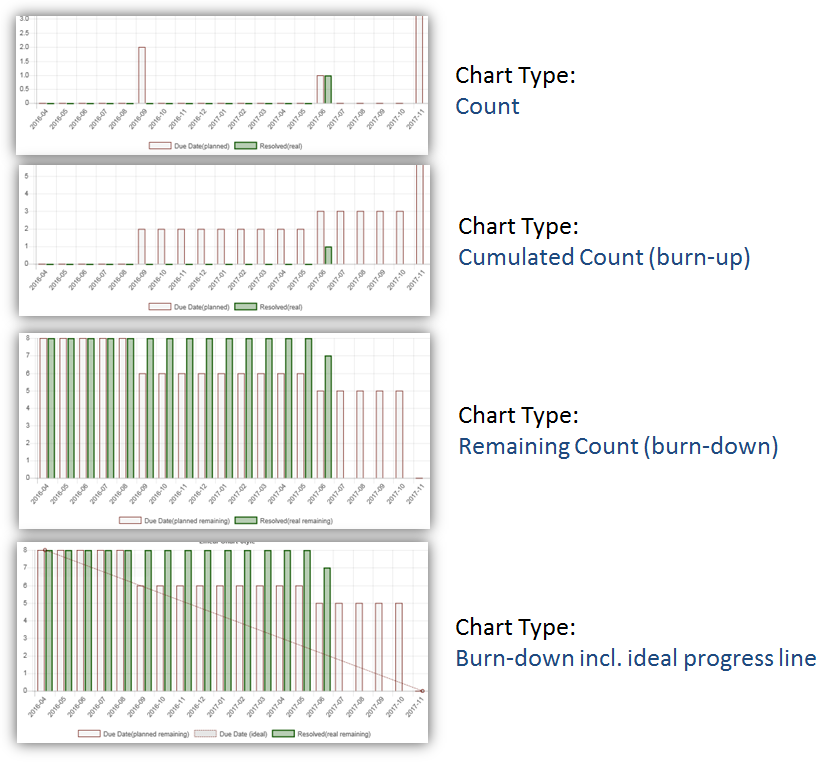
Three different chart options are possible
- Count: shows number of tickets in a certain time interval (e.g. per day/week/month)
- Cumulated Count (burn-up): shows cumulated (increasing) number of tickets
- Remaining Count (burn-down): shows ticket progress as burn-down
- Burn-down including ideal progress line: shows burndon including an ideal line
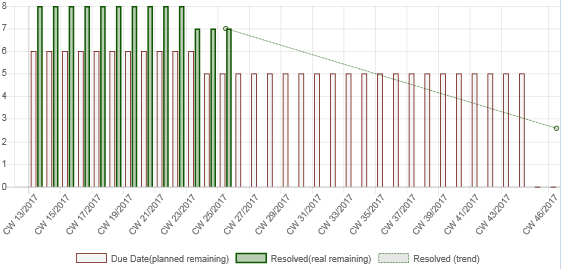
Burndown Trend
Only for burndown charts a trend line can be optionally shown in a chart for real progress data This line will show the assumed progress based on average progress of previous x days. x can be configured as the previous 2, 7, 14, 30, 90 days before today.
Following example shows a burndown trend based on average progress of last 30 days:
Y-Axis: Valuetype
The Y-Axis valuetpye defines how real and progress data is summed up:
- Issue Count: chart shows always the number of issues related to a chart element.
- <number field>: chart sums up the values of a certain number field of all issues related to a chart element.
Using this option you can show the progress based effort or story points. Instead of just counting tickets the chart indicates effort and gives a better underrstanding of your planned and real progress.
Backlog Growth
You can add a backlog growth line to your burnddown charts. This line indicates additions to your backlog during the selected time period.
An example is shown below:
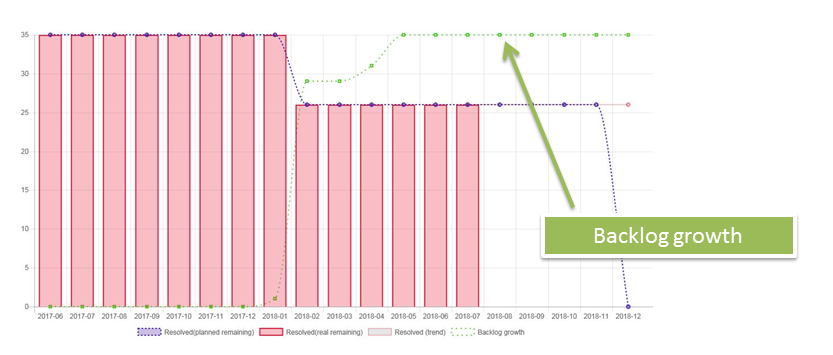
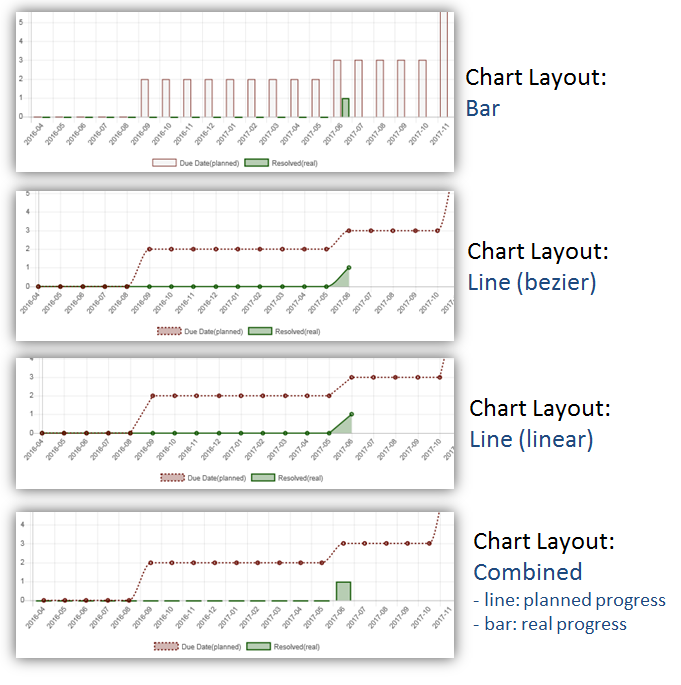
Chart Layout
Chart Layout
Use this dropdown list to select your preferred chart layout:
- bar: shows all data using bars
- line (linear): show data using lines, linear connections between points
- line (bezier): show data using lines,
- combined: shows planned progress as dashed line, real progress as bar
hart Title
This field can be used to insert your own chart title which is shown above the chart area.
Chart Legend
This multi select list defines which items in the legend the chart shall show:
- dataset/color legend
- y-axis description
- x-axis interval
- used filter
- total issue number
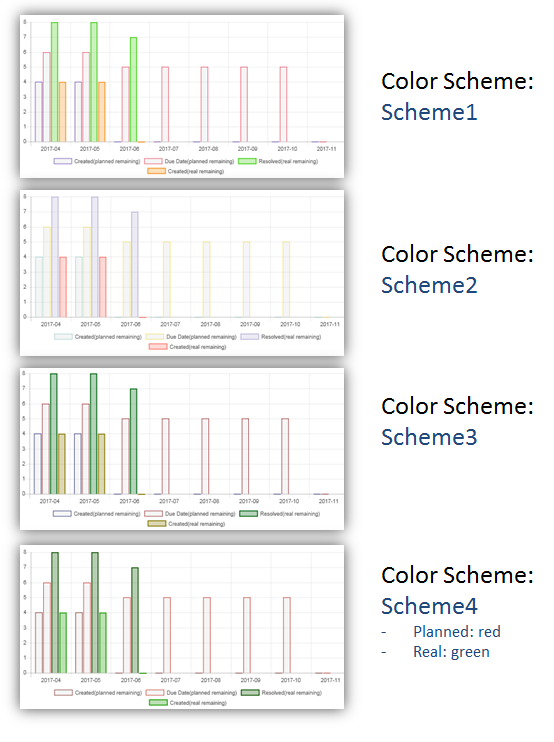
Color Scheme
Using the color scheme option the colors of the chart can be adjusted. Four color sets are available.
Color set number four is special in that way that planned data is always shown in reddish, real data in greenish colors.
Time Axis Setup
X-Axis Range
This field defines the rage of the horizontal x-axis. The date rage can be define manullay or automaically based on todays date. Auto-range keeps the center of the chart at today's date. Options are:
- manual start and end date: range is defined by specific start and end date configuration
- today +/- 10 days (previous and next 10 days)
- today +/- 30 days
- today +/- 100 days
- current week
- current week +/- 2 weeks (previous and next two weeks)
- current month
- current month +/- 1 month (previous and next month)
X-Axis: manual start date
Sets the start date of the chart. Has an effect only, if x-axis range is setr to "manual start and end date".
X-Axis: manual end date
Sets the end date of the chart. Has an effect only, if x-axis range is setr to "manual start and end date".
X-Axis: Interval
Defines period used for intervals on x-axis. Options are
- monthly interval
- weekly (ISO) - CW axis: week number scheme follow ISO 8601 definition: first week of yer is including Jan 4th. First day of week starts on monday.
- weekly (US) - CW axis: follows week number scheme used e.g. in U.S.: first years week is always at Jan 1st. First day of week is sunday.
- weekly (ISO) - date axis: first week of yer is including Jan 4th. First day of week starts on monday.
- weekly (US) - date axis: first years week is always at Jan 1st. First day of week is sunday.
- daily interval
Misc
Refresh Interval
Specifies period of how often the chart shall refresh its content automatically.
Frequently asked Questions
Is there any limitation of a maximum number of issues the chart can process?
No, not anymore.
Jira® limits the number of tickets a user can request using the REST API. Refer to the following article on the Atlassian® website for some hints on how to configure the Jira® server settings to adjust the configured max number: https://confluence.atlassian.com/jirakb/exporting-a-filter-result-containing-more-than-1000-issues-191500982.html
PlanChart2D versions older than 1.12.0.0 relax this limitation by repeating issue requests 10 times. This means the max number of issues in PlanChart2D is currently 10*<maxResult>. A standard configuration is 1000 issues on your server, so most likely you are able to process 10.000 issues.
From version 1.12.0.0 onwards, PlanChart automatically requests sequentually the next amount of issues until all issues are received.
Is there a limitation when opening a ticket list?
You are able to get the list of related tickets when clicking on a chart element. The longer the list of tickets is, the longer the used URL for the ticket list will be. Theoretically there is a browser specific limit which heavily depends on your browser type and version. Pls report any issue to us.
Third Party IP used in PlanChart2D
Chart.js (v2.4.0)
This gadget plugin uses parts of Chart.js (v2.4.0): http://chartjs.org/ https://github.com/chartjs/Chart.js/blob/master/LICENSE.md
The MIT License (MIT) Copyright (c) 2013-2016 Nick Downie
Permission is hereby granted, free of charge, to any person obtaining a copy of this software and associated documentation files (the "Software"), to deal in the Software without restriction, including without limitation the rights to use, copy, modify, merge, publish, distribute, sublicense, and/or sell copies of the Software, and to permit persons to whom the Software is furnished to do so, subject to the following conditions:
The above copyright notice and this permission notice shall be included in all copies or substantial portions of the Software.
THE SOFTWARE IS PROVIDED "AS IS", WITHOUT WARRANTY OF ANY KIND, EXPRESS OR IMPLIED, INCLUDING BUT NOT LIMITED TO THE WARRANTIES OF MERCHANTABILITY, FITNESS FOR A PARTICULAR PURPOSE AND NONINFRINGEMENT. IN NO EVENT SHALL THE AUTHORS OR COPYRIGHT HOLDERS BE LIABLE FOR ANY CLAIM, DAMAGES OR OTHER LIABILITY, WHETHER IN AN ACTION OF CONTRACT, TORT OR OTHERWISE, ARISING FROM, OUT OF OR IN CONNECTION WITH THE SOFTWARE OR THE USE OR OTHER DEALINGS IN THE SOFTWARE.
jquery
Copyright jQuery Foundation and other contributors, https://jquery.org/ This software consists of voluntary contributions made by many individuals. For exact contribution history, see the revision history available at https://github.com/jquery/jquery-ui The following license applies to all parts of this software except as documented below:
Permission is hereby granted, free of charge, to any person obtaining a copy of this software and associated documentation files (the "Software"), to deal in the Software without restriction, including without limitation the rights to use, copy, modify, merge, publish, distribute, sublicense, and/or sell copies of the Software, and to permit persons to whom the Software is furnished to do so, subject to the following conditions: The above copyright notice and this permission notice shall be included in all copies or substantial portions of the Software. THE SOFTWARE IS PROVIDED "AS IS", WITHOUT WARRANTY OF ANY KIND, EXPRESS OR IMPLIED, INCLUDING BUT NOT LIMITED TO THE WARRANTIES OF MERCHANTABILITY, FITNESS FOR A ARTICULAR PURPOSE AND NONINFRINGEMENT. IN NO EVENT SHALL THE AUTHORS OR COPYRIGHT HOLDERS BE LIABLE FOR ANY CLAIM, DAMAGES OR OTHER LIABILITY, WHETHER IN AN ACTION OF CONTRACT, TORT OR OTHERWISE, ARISING FROM, OUT OF OR IN CONNECTION WITH THE SOFTWARE OR THE USE OR OTHER DEALINGS IN THE SOFTWARE.
jQuery-MultiSelect
Patrick Springstubbe https://github.com/nobleclem/jQuery-MultiSelect http://springstubbe.us
The MIT License (MIT)
Copyright (c) 2014
Permission is hereby granted, free of charge, to any person obtaining a copy of this software and associated documentation files (the "Software"), to deal in the Software without restriction, including without limitation the rights to use, copy, modify, merge, publish, distribute, sublicense, and/or sell copies of the Software, and to permit persons to whom the Software is furnished to do so, subject to the following conditions:
The above copyright notice and this permission notice shall be included in all copies or substantial portions of the Software.
THE SOFTWARE IS PROVIDED "AS IS", WITHOUT WARRANTY OF ANY KIND, EXPRESS OR IMPLIED, INCLUDING BUT NOT LIMITED TO THE WARRANTIES OF MERCHANTABILITY, FITNESS FOR A PARTICULAR PURPOSE AND NONINFRINGEMENT. IN NO EVENT SHALL THE AUTHORS OR COPYRIGHT HOLDERS BE LIABLE FOR ANY CLAIM, DAMAGES OR OTHER LIABILITY, WHETHER IN AN ACTION OF CONTRACT, TORT OR OTHERWISE, ARISING FROM, OUT OF OR IN CONNECTION WITH THE SOFTWARE OR THE USE OR OTHER DEALINGS IN THE SOFTWARE.
Updated