Wiki
Clone wikiATLAS / Diagnostics: qualityTransformation
Overview
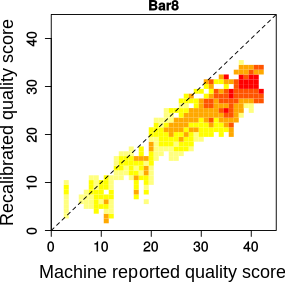
qualityTransformation allows you to track how the base quality scores are transformed by recalibration (either BQSR or recal). Specifically, you can make pairwise comparisons between two sets of quality scores:
- the original quality scores versus those obtained through BQSR or recal recalibration
- the quality scores resulting from BQSR versus those resulting from a run of recal
- the quality scores resulting from two different runs of recal, e.g. one performed using the X chromosome and one performed using mitochondrial DNA
The log file reports the R squared, which represents the correlation between the two sets of quality scores.
Input
- A BAM file
- recalibration file
- optional: PMD input file
Output
- A table per read group, summarizing the proportion of sites that were transformed from quality1 to quality2. If the original quality scores were compared to the recalibrated quality scores (either BQSR or recal) the lines are the original quality scores and the columns the recalibrated quality scores. If the quality scores from recal were compared to BQSR or recal2, the lines are the recal quality scores and the columns are the BQSR or recal2 quality scores.
Usage Example
Comparing the original quality scores to those obtained through BQSR:
./atlas task=qualityTransformation bam=example.bam BQSRQuality=Quality_recalibration_table.txt BQSRPosition=Position_recalibration_table.txt BQSRPositionReverse=PositionReverse_recalibration_table.txt BQSRContext=Context_recalibration_table.txt pmdFile=example_PMD_input_Empiric.txt
Comparing the original quality scores to those obtained through recal:
./atlas task=qualityTransformation bam=example.bam recal=example_recalibrationEM.txt pmdFile=example_PMD_input_Empiric.txt
Comparing BQSR-transformed quality scores to recal-transformed quality scores:
./atlas task=qualityTransformation bam=example.bam recal=example_recalibrationEM.txt BQSRQuality=Quality_recalibration_table.txt BQSRPosition=Position_recalibration_table.txt BQSRPositionReverse=PositionReverse_recalibration_table.txt BQSRContext=Context_recalibration_table.txt pmdFile=example_PMD_input_Empiric.txt
Comparing the quality transformations of two different runs of recal, e.g. one performed using the X chromosome and one performed using mitochondrial DNA:
./atlas task=qualityTransformation bam=example.bam recal=chrX_recalibrationEM.txt recal2=MT_DNA_recalibrationEM.txt pmdFile=example_PMD_input_Empiric.txt
Specific Arguments
- BQSRQuality/BQSRPosition/BQSRPositionReverse/BQSRContext : specify recalibration tables resulting from BQSR
- recal : specify the first recal table if you want to compare two tables resulting from recal, or the only recal table if you want to compare one recal table to a BQSR table
- recal2 : specify the second recal table if you want to compare two tables resulting from recal
- maxQ : maximum phred-scaled quality score to be considered. Default = 100
Engine Parameters
Engine parameters that are common to all tasks can be found here.
Create Transformation Plots with R
library(fields)
args <- commandArgs(TRUE)
x<-read.table(paste(args[1],"_qualityTransformation.txt",sep=''))[,-1]
z<-as.matrix(x)[-1,]
color = function(x)rev(heat.colors(x))
vbreak_labels=c("1e-6","1e-5","1e-4","1e-3","1e-2","1e-1", "0")
vbreaks=-6:0
cex.par=1.5

pdf(paste(args[1], "_qualityTransformation.pdf", sep=''), height=8, width=8)
image.plot(c(1:101), c(1:101), log10(z), col=color(length(vbreaks)-1), breaks=vbreaks, xlab="original quality/recal quality", ylab="recalibrated quality/recal2 quality/BQSR quality", xlim=c(0,101), ylim=c(0,101), main=args[1], cex.lab=cex.par, cex.axis=cex.par, cex.main=cex.par, axis.args=list(labels=vbreak_labels, at=vbreaks))
lines(c(0,101),c(0,101),lty=2)
dev.off()
Updated