Wiki
Clone wikiACID - Artefact correction in diffusion MRI / ACIDpipelines / ACIDpipelines_COVIPER
Example batches of recommended ACID pipelines
3. Signal-dropout due to patient table vibration
For diffusion data, which were acquired with EPI and affected by vibration and susceptibility artifacts, we recommend the example batch "ECMOCOandHySCOandCOVIPER.mat", which is located in the ACID toolbox in the folder "ExampleBatches" or here/ExampleBatches.zip.
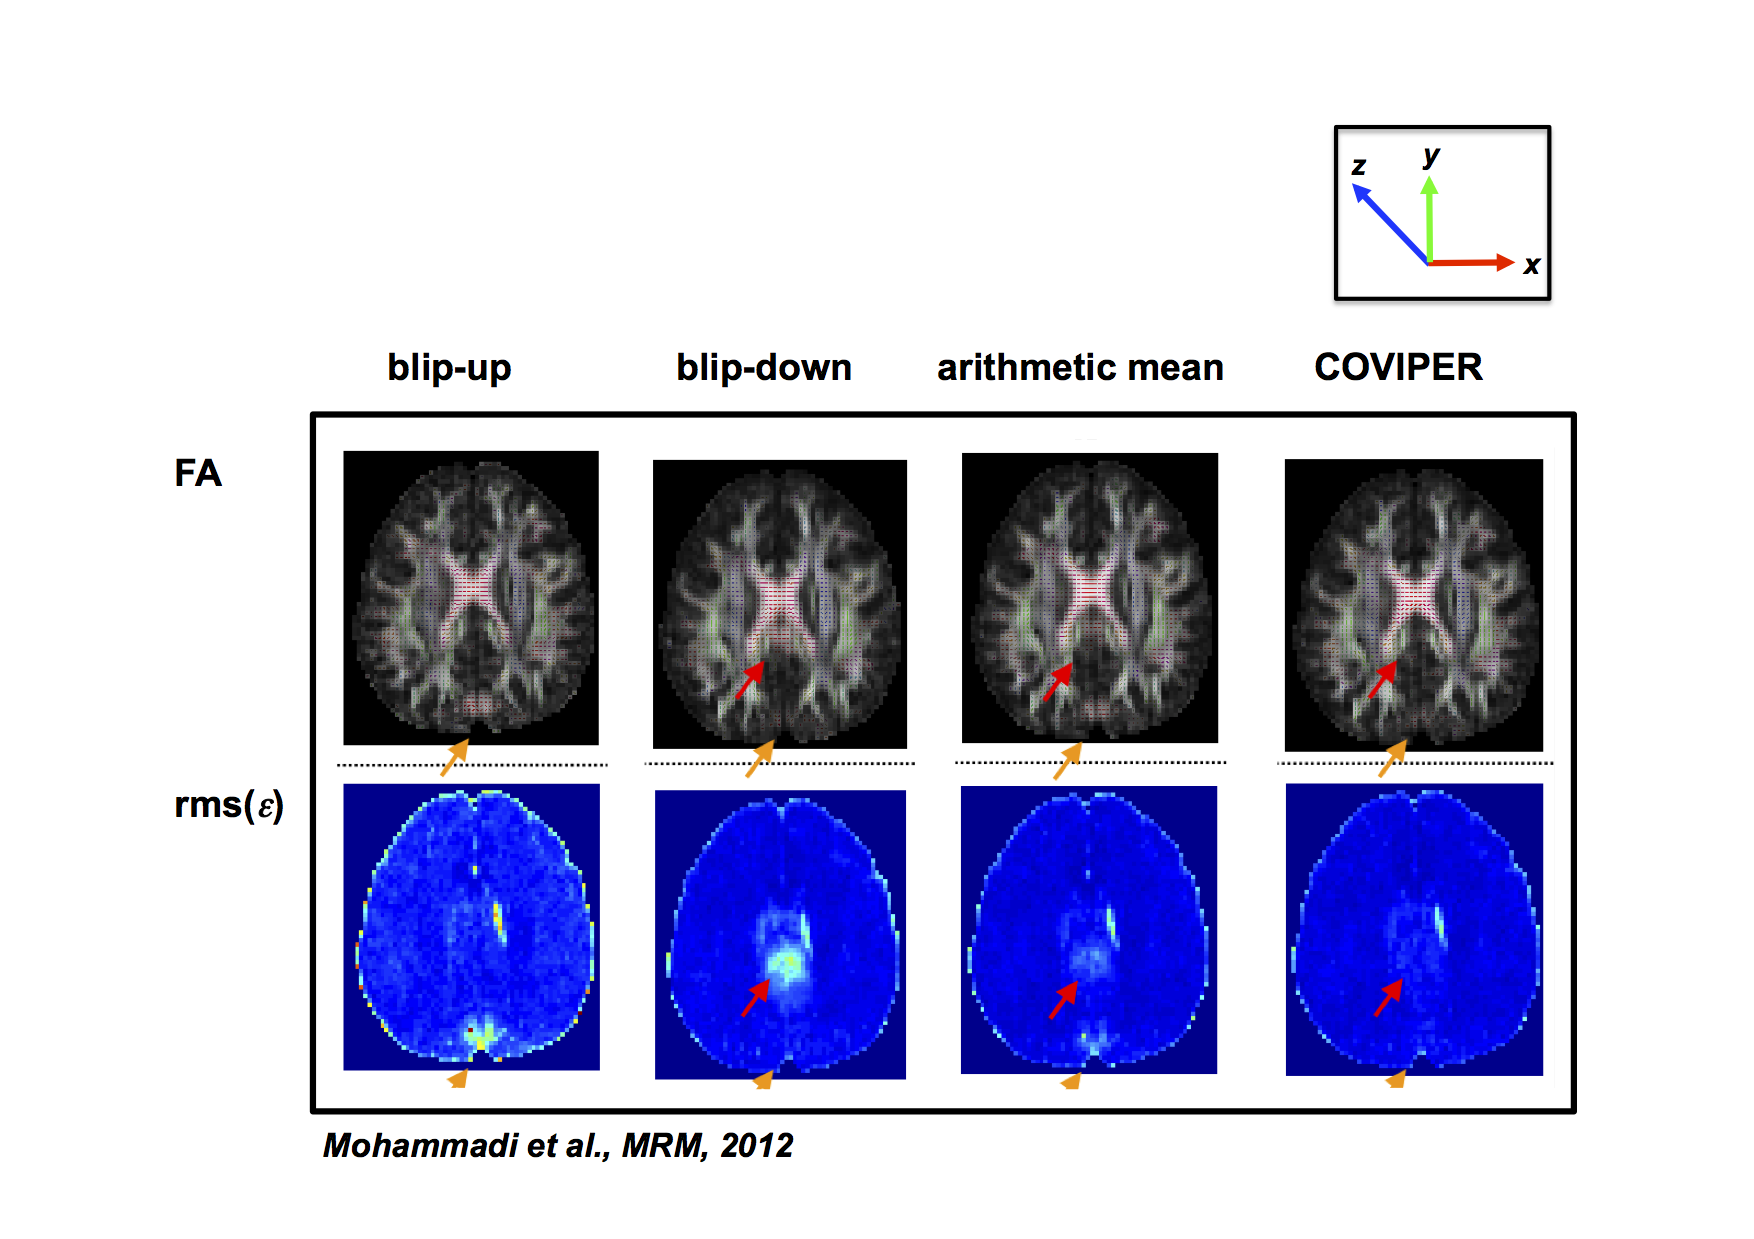
This batch corrects first for eddy current and subject motion, then for susceptibility distortions, and finally for vibration artifacts using COVIPER, (Fig. 3 shows example for FA map that is biased by vibration artifacts). For using this batch, you need to acquire, in addition to the normal DTI dataset, a DTI dataset with opposite phase-encoding direction, i.e. two DTI datasets, one with blip-up and the other with blip-down.

Fig. 3: The FA (top row) in gray scale overlaid by the principal eigenvector in rgb-colors (red = x, green = y, and blue = z direction) and the root-mean-square of tensor fit error (rms(e)) in color (bottom row): (a) blip- up, (b) blip-down, (c) the arithmetic mean of blip-up and blip-down, (d) COVIPER. The vibration artifact leads to a bias in the FA maps (arrows), which is clearly visible in the blip-up (a) and blip-down (b) data as an artificial left-right connection (high FA values in red). The bias in FA is accompanied by an increased rms(e) (arrows). COVIPER (d) reduced the bias in the FA maps. Note that the FA-bias artifact is visible in both locations (red and yellow arrows) when using the standard arithmetic-mean combination (c).
Note this page is under construction and will increase with your help! So if you have further questions and suggestions please send them via the SPM mailing list.
Updated