Wiki
Clone wikienterobase-web / MSTree tut 1
Top level links:
- Main top level page for all documentation
- EnteroBase Features
- Registering on EnteroBase and logging in
- Tutorials
- Using the API
- About the underlying pipelines and other internals
- How schemes in EnteroBase work
- FAQ
Creating an MS Tree of all Salmonella typhi and adding third party genotype data
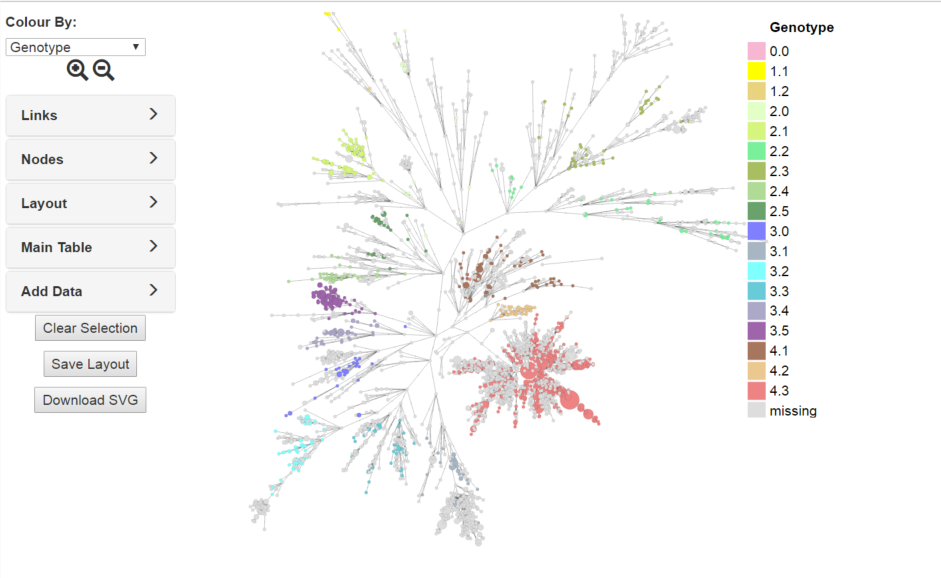
In this tutorial a tree of all predicted Salmonella typhi will be created and genotype data from the Wong et al paper. A public version of this tree can be viewed here
##Getting all the typhi strains in Enterobase##
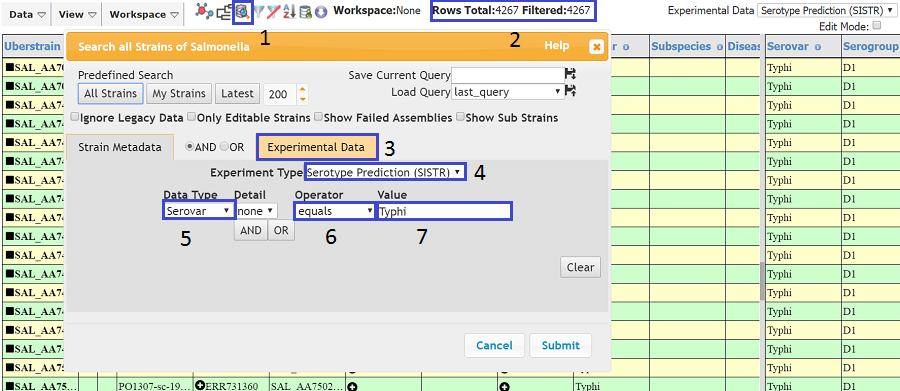
We could search on Serovar in the strain metadata, but often it is missing or incorrect. Therefore, we will search on Serotype Prediction in Experimental Data. If is is not already displayed, click on the search icon (1) and the search dialog should appear. Next, go to the Experimenta Data tab (3) and select Serotype Prediction (SISTR) from the Experiment Type dropdown. Select Serovar from the Data Type dropdown (5), equals from the Operator dropdown (6) and type Typhi in the Value text box (7) Press submit and a 'Processing Query' box should appear. After a few seconds, the strains searched for should appear in the table. The number of strains will appear in the top bar (2) , although this number will probably differ to that in the above image as more typhi may have been added since this tutorial was written.
##Creating The MS Tree##
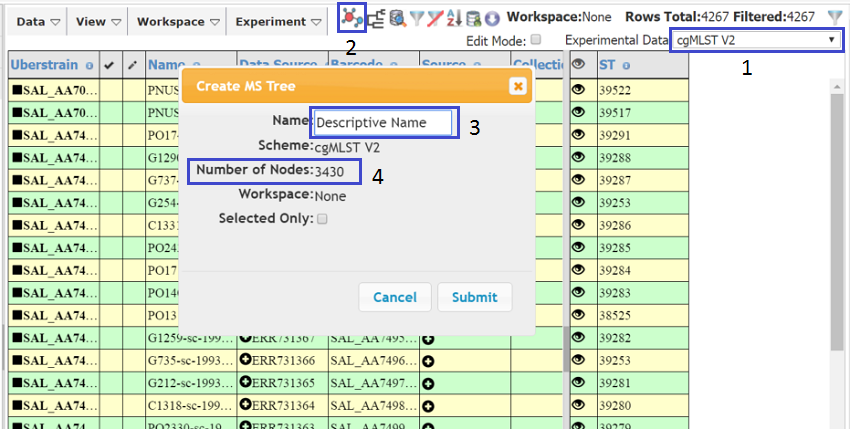
For full instructions on creating MS Trees see here. To create the tree make sure you have the appropriate data in the right hand (Experiment) table. In this case, select cgMLST V2 from the Experiment Data dropdown (1). Then press the MS Tree icon (2) and a dialog should appear. Give a descriptive name to the tree (3). You will notice that the number of nodes is displayed (3430 in this case, although this will differ as more data is added to Enterobase).The number can be less than the number of strains, as some strains may share the same ST (allelic profile). After pressing Submit a popup window should appear (make sure your browser allows popups from this site). AS there are over 3000 nodes, tree creation may take a while so you can navigate away from the page and load the tree later.
##Manipulating The Tree##
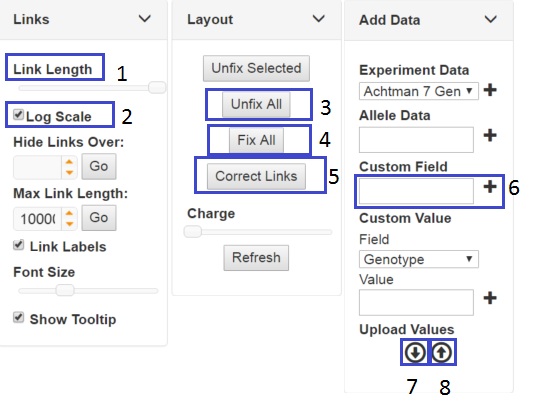
When trees are initially created , the nodes are positioned by a 'force' algorithm and subsequently the link lengths (distance between nodes) are adjusted to accurately reflect the number of allele differences. However, the default layout is not suitable for all types of data and will probably need adjusting. In this case, I set distance to log scale (2) and increased the link length to maximum (1) in the Links tab. To help de-tangle the tree, you can unfix all nodes (3) and you see the tree will pull apart. You can then re-fix the nodes(4) and the tree may look better, but the length between nodes may no longer be that accurate (you may prefer it this way). However, you can correct the link lengths to accurately reflect the allele differences between nodes (5). Make sure you save the tree layout (the button at the bottom of the left hand panel) before you leave the page. You will also probably have to drag a few nodes manually into the right position in order to get the tree to luck just right.
##Adding Data to the Tree##
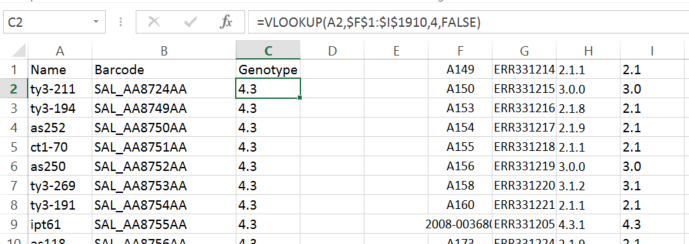
First of all in the Add Data tab, add a custom Field by typing Genotype in the Custom Field text input(6) and click the cross next to it. Next download a template by clicking the download icon (7). Open the downloaded template file in excel or another spread sheet and you will see two columns Barcode and Name. Next we need to associate the Name (and Barcode) with the Genotype data in the Wong et al supplementary table. This can be achieved in many ways e.g writing a script. However, in this case an extra column 'Genotype' was added to the excel spread sheet, data from the supplementary excel table was also cut and pasted in and a VLOOKUP on Name between the two sets of data was performed (see above). The resultant table will have three columns, Name, Barcode and Genotype which should be saved as tab delimited text and then uploaded by the upload icon (8). Once this has been done, Genotype should appear under Custom Fields in the 'Colour By' dropdown at the top of the left hand panel. Selecting this will colour the tree with the Genotype data you just uploaded. Remember to save the layout if you want the data to be permanent. You can then alter the colours to reflect those in the paper by clicking on the coloured squares in the legend and selecting an appropriate colour.
Updated